USA Baby Names Analysis
Are baby names a reflection of our culture?
A few million parents pick names for their babies every year. If each name serves as a small vote about gender, individuality, sound, identity, what patterns can we find and what do they say about us?
2025 (latest year)
| # | Name | Births |
|---|---|---|
| 1 | Olivia | 13.5k0.41% |
| 2 | Charlotte | 13.4k0.40% |
| 3 | Emma | 12.8k0.38% |
| 4 | Amelia | 12.7k0.38% |
| 5 | Sophia | 12.6k0.38% |
| 6 | Mia | 11.1k0.33% |
| 7 | Isabella | 10.7k0.32% |
| 8 | Evelyn | 9.1k0.28% |
| 9 | Sofia | 8.3k0.25% |
| 10 | Eliana | 8.2k0.25% |
| # | Name | Births |
|---|---|---|
| 1 | Liam | 20.8k0.63% |
| 2 | Noah | 20.4k0.61% |
| 3 | Oliver | 14.9k0.45% |
| 4 | Theodore | 13.4k0.40% |
| 5 | Henry | 12.0k0.36% |
| 6 | James | 11.9k0.36% |
| 7 | Elijah | 11.1k0.34% |
| 8 | Mateo | 11.0k0.33% |
| 9 | William | 10.5k0.32% |
| 10 | Lucas | 10.2k0.31% |
| # | Name | F+M | Lean then | Lean 2025 |
|---|---|---|---|---|
| 1 | Riley | 6.1k0.18% | ||
| 2 | Parker | 6.0k0.18% | ||
| 3 | Charlie | 4.6k0.14% | ||
| 4 | River | 4.5k0.14% | ||
| 5 | Sawyer | 4.0k0.12% | ||
| 6 | Emerson | 3.6k0.11% | ||
| 7 | Tatum | 3.4k0.10% | ||
| 8 | Rory | 3.1k0.09% | ||
| 9 | Hayden | 3.0k0.09% | ||
| 10 | Amari | 2.8k0.08% |
How do you define a generational boundary?
We use the windows Pew Research uses for the modern generations:
- Silent (1928–1945)
- Boomers (1946–1964)
- Gen X (1965–1980)
- Millennials (1981–1996)
- Gen Z (1997–2012)
- Gen Alpha (2013–2025)
Pew's framework only covers people born after 1928. The SSA dataset starts in 1880, so we group the 1880–1927 cohort into a single bucket we call Pre-Silent. That window spans roughly two demographic generations (the Lost Generation and the Greatest Generation), but treating it as one block keeps the table cell counts comparable and avoids carving up the early years where data is sparser.
Generational boundaries are conventional, not natural. Pew itself notes that any cutoff is somewhat arbitrary and chosen for analytic convenience. We use them here because they give recognizable cohort labels that most readers already have intuitions about.
How are fastest-rising names defined?
Within each generation, we compare a name’s average prevalence in the first three years with its average prevalence in the final three years, then rank the percentage-point increase. Female and male names use their share of births recorded for that sex. Gender-neutral names use their share of all births and must meet the same definition used elsewhere on this page: at least 20% of usage from each sex and at least 100 births for the minority sex in a centered 10-year window, plus the same balance across the generation overall. Every name must also have at least 500 births during the generation and 100 in its final three years.
Gen Alpha (2013–2025)
| # | Name | Births |
|---|---|---|
| 1 | Olivia | 229K0.50% |
| 2 | Emma | 223K0.49% |
| 3 | Sophia | 191K0.42% |
| 4 | Isabella | 176K0.39% |
| 5 | Ava | 173K0.38% |
| 6 | Mia | 163K0.36% |
| 7 | Charlotte | 161K0.36% |
| 8 | Amelia | 151K0.33% |
| 9 | Evelyn | 123K0.27% |
| 10 | Harper | 118K0.26% |
| # | Name | Births |
|---|---|---|
| 1 | Liam | 257K0.57% |
| 2 | Noah | 248K0.55% |
| 3 | William | 177K0.39% |
| 4 | James | 171K0.38% |
| 5 | Oliver | 171K0.38% |
| 6 | Elijah | 167K0.37% |
| 7 | Benjamin | 161K0.35% |
| 8 | Lucas | 153K0.34% |
| 9 | Mason | 152K0.33% |
| 10 | Michael | 147K0.32% |
| # | Name | F+M | Lean then | Lean 2025 |
|---|---|---|---|---|
| 1 | Riley | 92.3k0.20% | ||
| 2 | Parker | 81.3k0.18% | ||
| 3 | Sawyer | 60.2k0.13% | ||
| 4 | Rowan | 56.0k0.12% | ||
| 5 | Peyton | 50.5k0.11% | ||
| 6 | Quinn | 50.1k0.11% | ||
| 7 | Charlie | 49.9k0.11% | ||
| 8 | Blake | 49.1k0.11% | ||
| 9 | River | 48.1k0.11% | ||
| 10 | Hayden | 46.9k0.10% |
Gen Z (1997–2012)
| # | Name | Births |
|---|---|---|
| 1 | Emily | 344K0.57% |
| 2 | Madison | 281K0.47% |
| 3 | Emma | 268K0.44% |
| 4 | Hannah | 240K0.40% |
| 5 | Olivia | 239K0.40% |
| 6 | Abigail | 224K0.37% |
| 7 | Isabella | 223K0.37% |
| 8 | Samantha | 216K0.36% |
| 9 | Elizabeth | 210K0.35% |
| 10 | Ashley | 208K0.34% |
| # | Name | Births |
|---|---|---|
| 1 | Jacob | 441K0.73% |
| 2 | Michael | 409K0.68% |
| 3 | Joshua | 358K0.59% |
| 4 | Matthew | 357K0.59% |
| 5 | Christopher | 324K0.54% |
| 6 | Daniel | 319K0.53% |
| 7 | Andrew | 316K0.52% |
| 8 | William | 307K0.51% |
| 9 | Joseph | 304K0.50% |
| 10 | Anthony | 294K0.49% |
| # | Name | F+M | Lean then | Lean 2025 |
|---|---|---|---|---|
| 1 | Jordan | 236K0.39% | ||
| 2 | Angel | 170K0.28% | ||
| 3 | Riley | 125K0.21% | ||
| 4 | Avery | 92.9k0.15% | ||
| 5 | Peyton | 81.6k0.14% | ||
| 6 | Dakota | 66.7k0.11% | ||
| 7 | Payton | 54.9k0.09% | ||
| 8 | Skylar | 44.0k0.07% | ||
| 9 | Skyler | 37.2k0.06% | ||
| 10 | Casey | 36.8k0.06% |
Millennials (1981–1996)
| # | Name | Births |
|---|---|---|
| 1 | Jessica | 683K1.2% |
| 2 | Ashley | 588K1.0% |
| 3 | Jennifer | 497K0.85% |
| 4 | Amanda | 492K0.84% |
| 5 | Sarah | 412K0.70% |
| 6 | Stephanie | 324K0.55% |
| 7 | Elizabeth | 306K0.52% |
| 8 | Brittany | 301K0.51% |
| 9 | Nicole | 297K0.51% |
| 10 | Emily | 282K0.48% |
| # | Name | Births |
|---|---|---|
| 1 | Michael | 949K1.6% |
| 2 | Christopher | 784K1.3% |
| 3 | Matthew | 680K1.2% |
| 4 | Joshua | 606K1.0% |
| 5 | David | 532K0.91% |
| 6 | Daniel | 518K0.88% |
| 7 | James | 503K0.86% |
| 8 | Andrew | 466K0.79% |
| 9 | John | 464K0.79% |
| 10 | Joseph | 460K0.78% |
| # | Name | F+M | Lean then | Lean 2025 |
|---|---|---|---|---|
| 1 | Jordan | 213K0.36% | ||
| 2 | Taylor | 194K0.33% | ||
| 3 | Casey | 101K0.17% | ||
| 4 | Angel | 63.9k0.11% | ||
| 5 | Dominique | 46.4k0.08% | ||
| 6 | Jaime | 39.3k0.07% | ||
| 7 | Devon | 38.7k0.07% | ||
| 8 | Jessie | 35.8k0.06% | ||
| 9 | Kasey | 23.1k0.04% | ||
| 10 | Kendall | 22.2k0.04% |
Gen X (1965–1980)
| # | Name | Births |
|---|---|---|
| 1 | Jennifer | 752K1.4% |
| 2 | Lisa | 509K0.96% |
| 3 | Michelle | 410K0.78% |
| 4 | Kimberly | 407K0.77% |
| 5 | Melissa | 373K0.71% |
| 6 | Amy | 368K0.70% |
| 7 | Angela | 342K0.65% |
| 8 | Mary | 268K0.51% |
| 9 | Heather | 249K0.47% |
| 10 | Elizabeth | 241K0.46% |
| # | Name | Births |
|---|---|---|
| 1 | Michael | 1.19M2.2% |
| 2 | David | 816K1.5% |
| 3 | James | 799K1.5% |
| 4 | John | 756K1.4% |
| 5 | Robert | 727K1.4% |
| 6 | Christopher | 674K1.3% |
| 7 | Jason | 547K1.0% |
| 8 | William | 500K0.95% |
| 9 | Brian | 493K0.94% |
| 10 | Joseph | 408K0.77% |
| # | Name | F+M | Lean then | Lean 2025 |
|---|---|---|---|---|
| 1 | Jamie | 138K0.26% | ||
| 2 | Lee | 51.3k0.10% | ||
| 3 | Jody | 43.4k0.08% | ||
| 4 | Jaime | 43.1k0.08% | ||
| 5 | Angel | 37.5k0.07% | ||
| 6 | Kerry | 36.9k0.07% | ||
| 7 | Casey | 36.4k0.07% | ||
| 8 | Jackie | 29.3k0.06% | ||
| 9 | Jessie | 20.5k0.04% | ||
| 10 | Rene | 18.8k0.04% |
Boomers (1946–1964)
| # | Name | Births |
|---|---|---|
| 1 | Mary | 1.13M1.5% |
| 2 | Linda | 1.06M1.4% |
| 3 | Patricia | 789K1.1% |
| 4 | Susan | 750K1.0% |
| 5 | Barbara | 632K0.86% |
| 6 | Karen | 587K0.80% |
| 7 | Deborah | 582K0.79% |
| 8 | Nancy | 498K0.68% |
| 9 | Donna | 495K0.68% |
| 10 | Sandra | 492K0.67% |
| # | Name | Births |
|---|---|---|
| 1 | James | 1.57M2.1% |
| 2 | Robert | 1.53M2.1% |
| 3 | John | 1.53M2.1% |
| 4 | Michael | 1.46M2.0% |
| 5 | David | 1.40M1.9% |
| 6 | William | 1.07M1.5% |
| 7 | Richard | 960K1.3% |
| 8 | Thomas | 810K1.1% |
| 9 | Mark | 684K0.93% |
| 10 | Charles | 658K0.90% |
| # | Name | F+M | Lean then | Lean 2025 |
|---|---|---|---|---|
| 1 | Terry | 323K0.44% | ||
| 2 | Leslie | 119K0.16% | ||
| 3 | Kelly | 99.2k0.14% | ||
| 4 | Lee | 90.1k0.12% | ||
| 5 | Tracy | 74.6k0.10% | ||
| 6 | Jackie | 74.0k0.10% | ||
| 7 | Dana | 68.8k0.09% | ||
| 8 | Kerry | 39.5k0.05% | ||
| 9 | Johnnie | 37.7k0.05% | ||
| 10 | Marion | 35.8k0.05% |
Silent Generation (1928–1945)
| # | Name | Births |
|---|---|---|
| 1 | Mary | 1.07M2.6% |
| 2 | Barbara | 569K1.4% |
| 3 | Betty | 498K1.2% |
| 4 | Patricia | 468K1.1% |
| 5 | Shirley | 361K0.87% |
| 6 | Dorothy | 361K0.87% |
| 7 | Carol | 294K0.71% |
| 8 | Margaret | 293K0.71% |
| 9 | Nancy | 288K0.70% |
| 10 | Joan | 270K0.65% |
| # | Name | Births |
|---|---|---|
| 1 | Robert | 1.12M2.7% |
| 2 | James | 1.09M2.6% |
| 3 | John | 974K2.4% |
| 4 | William | 820K2.0% |
| 5 | Richard | 647K1.6% |
| 6 | Charles | 568K1.4% |
| 7 | Donald | 476K1.2% |
| 8 | Thomas | 395K0.96% |
| 9 | David | 392K0.95% |
| 10 | George | 360K0.87% |
| # | Name | F+M | Lean then | Lean 2025 |
|---|---|---|---|---|
| 1 | Willie | 159K0.39% | ||
| 2 | Marion | 72.2k0.17% | ||
| 3 | Billie | 54.4k0.13% | ||
| 4 | Jessie | 49.8k0.12% | ||
| 5 | Johnnie | 45.6k0.11% | ||
| 6 | Jackie | 44.0k0.11% | ||
| 7 | Bobbie | 41.8k0.10% | ||
| 8 | Leslie | 32.7k0.08% | ||
| 9 | Pat | 32.1k0.08% | ||
| 10 | Lynn | 29.9k0.07% |
Pre-Silent (1880–1927)
| # | Name | Births |
|---|---|---|
| 1 | Mary | 1.43M3.3% |
| 2 | Helen | 613K1.4% |
| 3 | Dorothy | 563K1.3% |
| 4 | Margaret | 512K1.2% |
| 5 | Ruth | 447K1.0% |
| 6 | Anna | 371K0.85% |
| 7 | Elizabeth | 334K0.77% |
| 8 | Mildred | 302K0.70% |
| 9 | Frances | 279K0.64% |
| 10 | Betty | 268K0.62% |
| # | Name | Births |
|---|---|---|
| 1 | John | 1.09M2.5% |
| 2 | William | 945K2.2% |
| 3 | James | 852K2.0% |
| 4 | Robert | 781K1.8% |
| 5 | Charles | 530K1.2% |
| 6 | George | 526K1.2% |
| 7 | Joseph | 470K1.1% |
| 8 | Edward | 357K0.82% |
| 9 | Frank | 330K0.76% |
| 10 | Thomas | 287K0.66% |
| # | Name | F+M | Lean then | Lean 2025 |
|---|---|---|---|---|
| 1 | Willie | 218K0.50% | ||
| 2 | Marion | 133K0.31% | ||
| 3 | Jessie | 116K0.27% | ||
| 4 | Johnnie | 45.0k0.10% | ||
| 5 | Ollie | 33.8k0.08% | ||
| 6 | Billie | 27.0k0.06% | ||
| 7 | Jimmie | 26.3k0.06% | ||
| 8 | Cleo | 23.9k0.06% | ||
| 9 | Laverne | 21.3k0.05% | ||
| 10 | Merle | 20.2k0.05% |
Name concentration
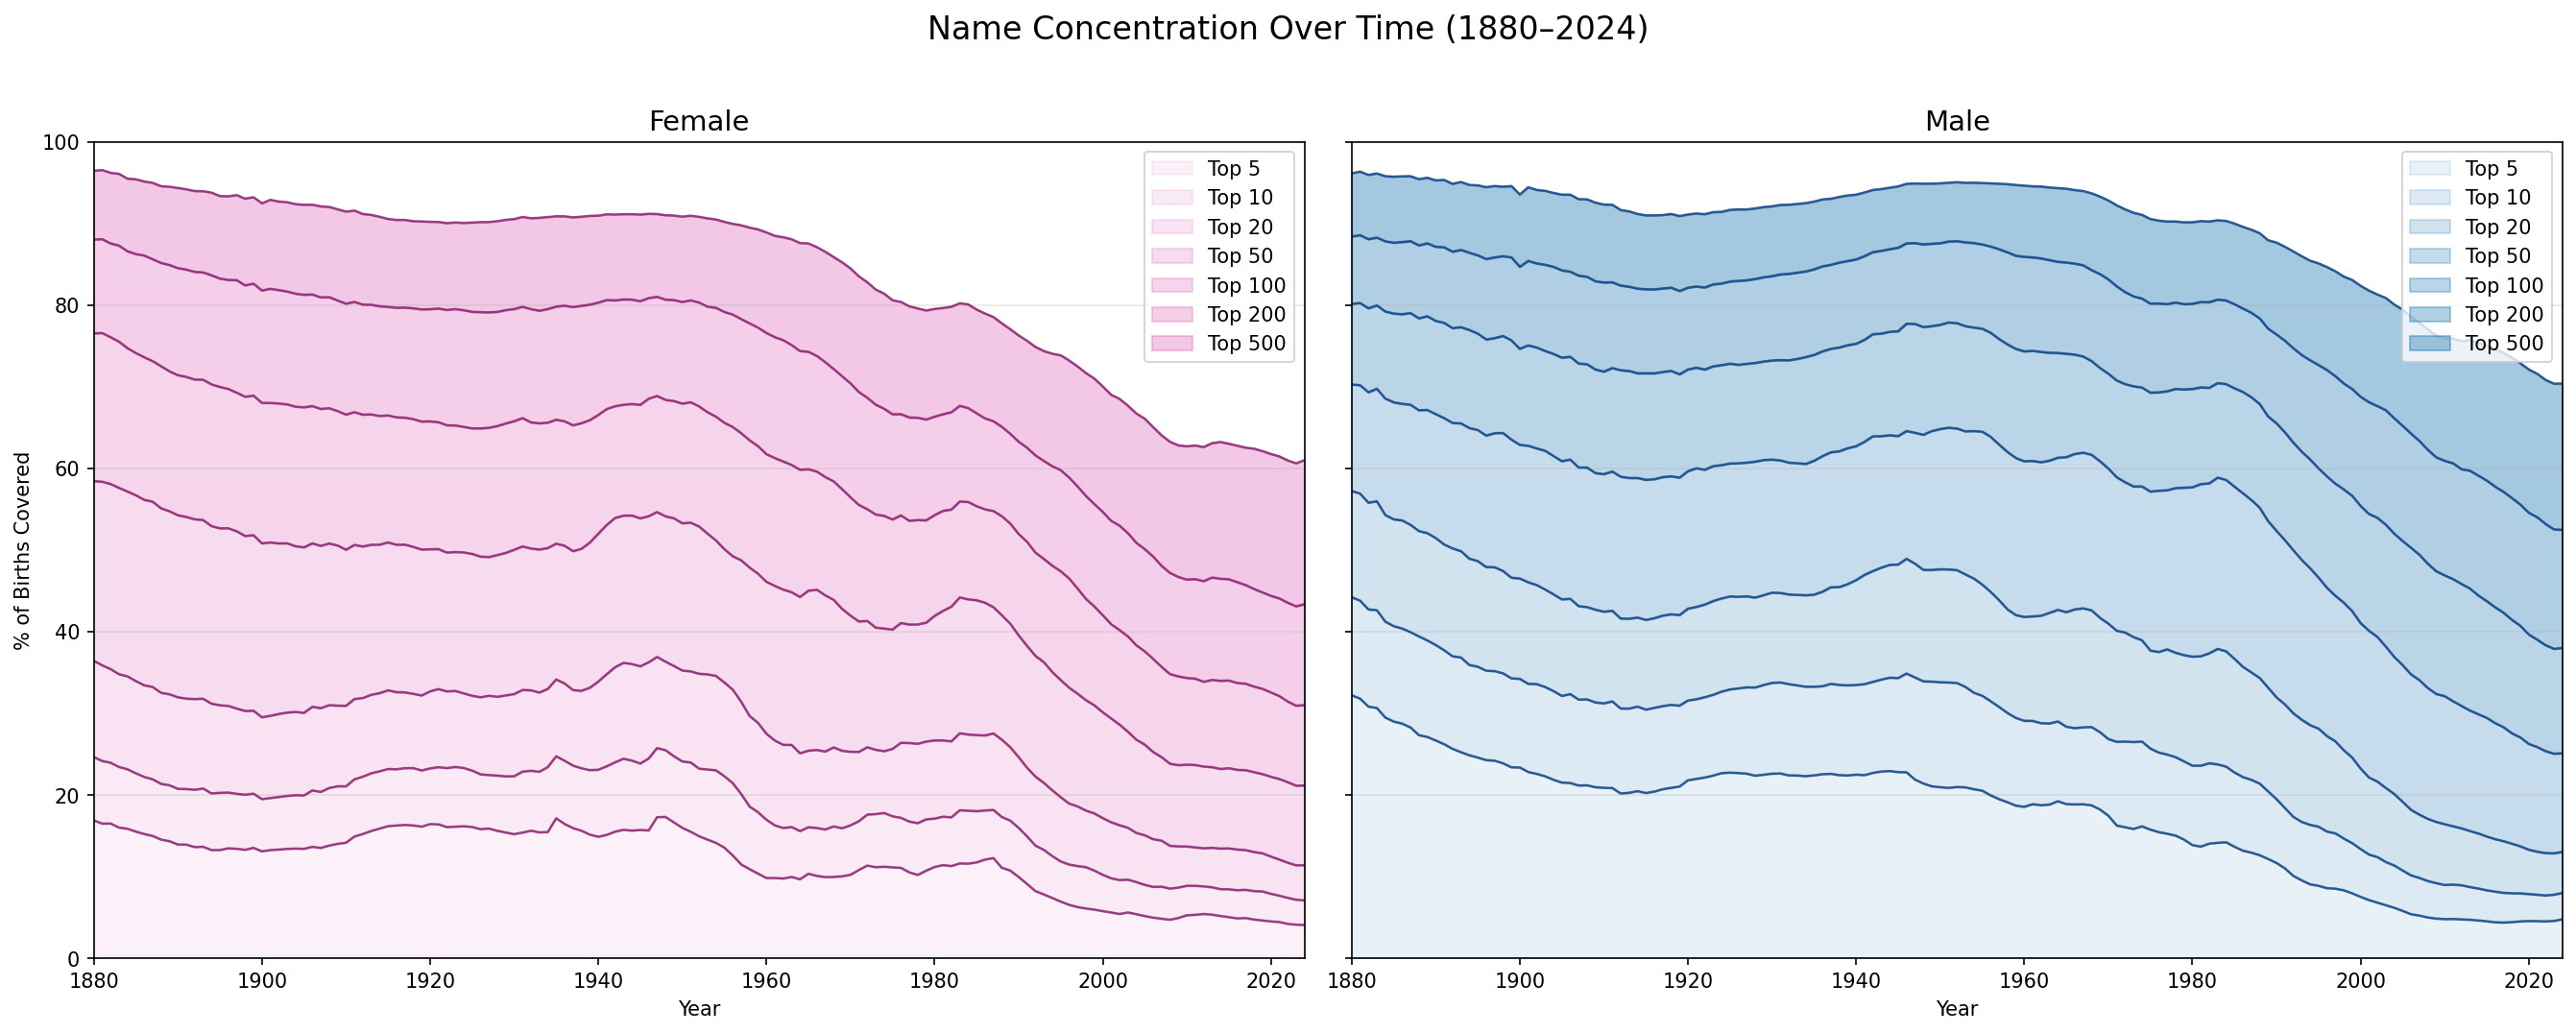
The percentage of births covered by the top-10 names have fallen sharply over time. In 1880, the top 10 female names covered 24.6% of all female births. Now, it's 7.1%. For males, the top 10 names covered 44.2% of all male births. Now, it's 8.0%. The percentage of births the top names covered was relatively steady from 1880 to 1950, with a sharp decline starting from around 1960.
Name entropy
If the top names are covering less births, is it because non-top names are getting used more or because there are more unique names overall, or both?
Per-capita name variety — unique names per million same-gender births — traces a U-shape for both genders, with a mid-century trough and a steep recovery after 1980. There are many more unique names today on an absolute basis, but per 1M births, it's roughly the same number as in 1880.
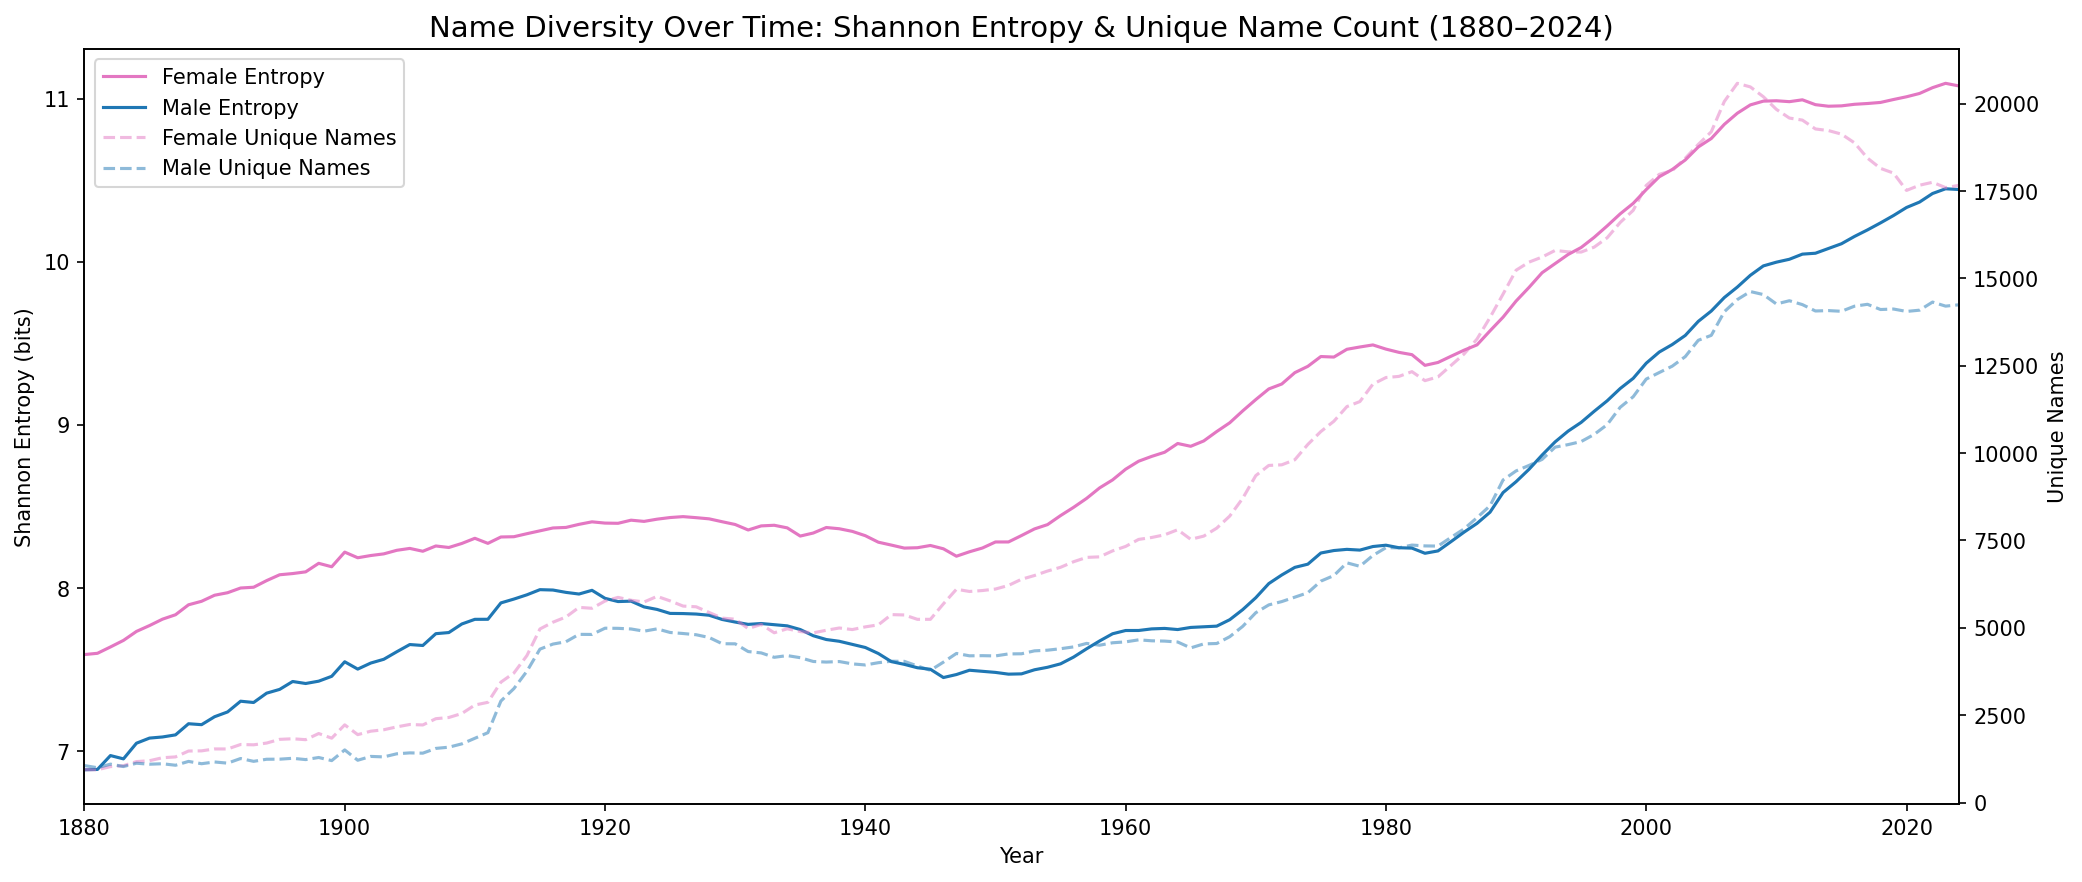
When we look at Shannon entropy, which measures how spread births are across names, we see a strong inflationary rise compared to the per-capita number of unique names.
How is entropy calculated?
For a given year, let $p_i$ be the proportion of births with name $i$. Shannon entropy is:
$$H = -\sum_{i=1}^{k} p_i \log_2 p_i$$
measured in bits. Intuitively, $H$ is the average number of yes/no questions you'd need to guess a random baby's name. The effective number of names — the number of equally-popular names that would produce the same $H$ — is $2^H$. An entropy of 10.5 bits ≈ 1,448 effective names.
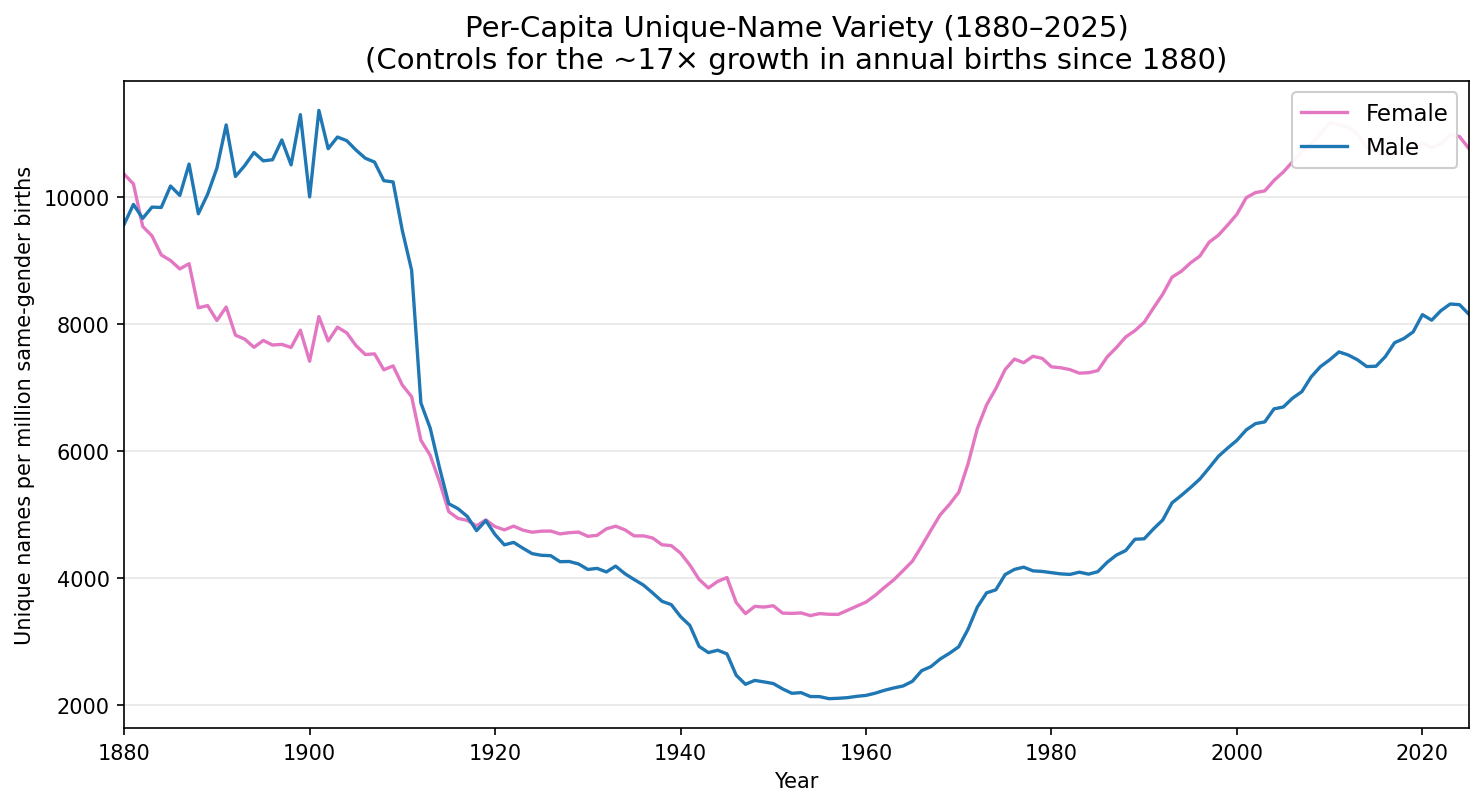
- Per-capita variety is a U-shape for both genders. Both lines bottomed around 1950 and have climbed steeply since 1980. At the trough: F ≈ 3.6K, M ≈ 2.3K unique names per million same-gender births. By 2024: F ≈ 10.9K, M ≈ 8.3K.
- Boy names used to be more varied than girl names. Before 1920, male names had more per-capita variety than female names. This flipped around 1920, and the gap has continued to widen.
- Female name entropy has always been higher, though. Across every year, girl name entropy has always been higher than that of boys. So in the pre-1920 era, even with fewer distinct female names, the names themselves were more evenly distributed among female births.
Comparing different entropies
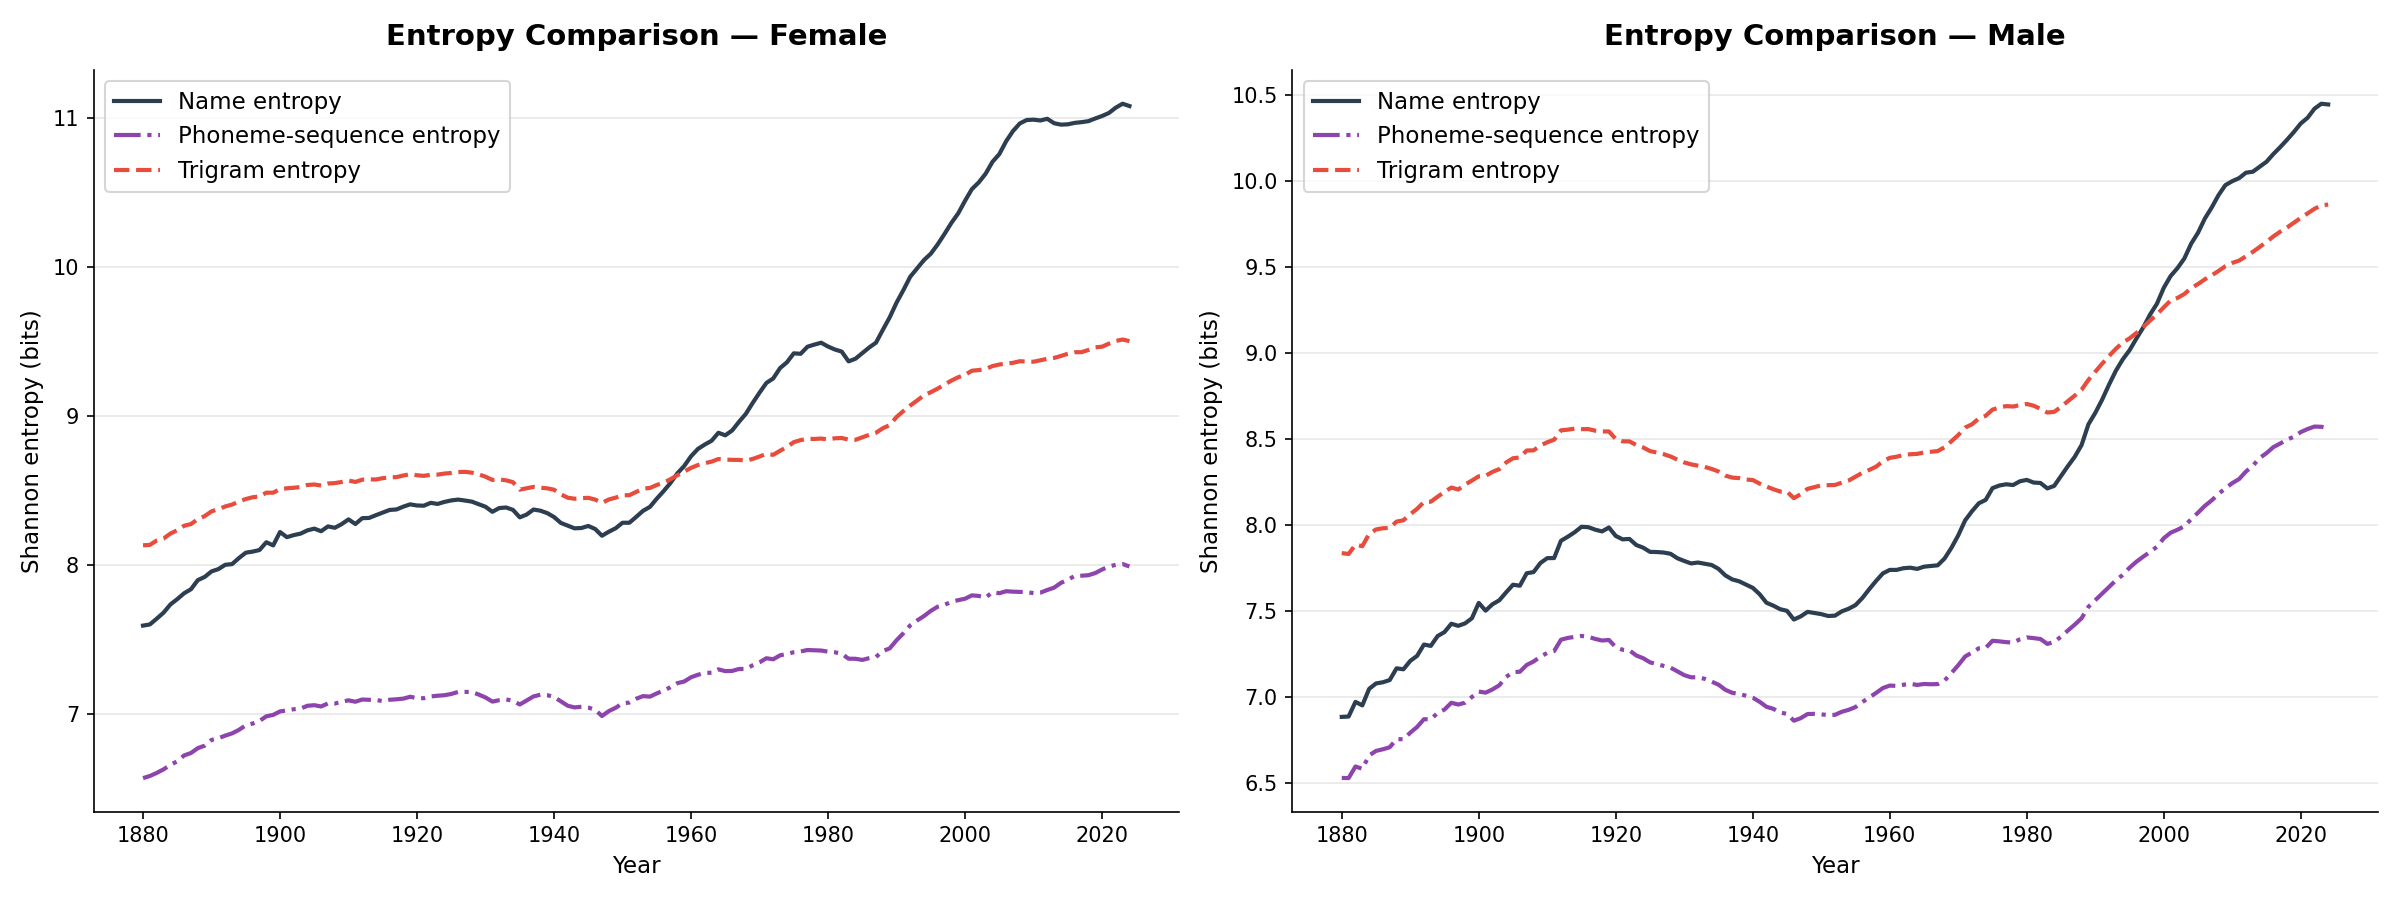
We can map each name to its phonetic spelling and measure entropy the same way. Since there are usually multiple letter combinations that correspond to the same phonetic spelling, phonetic entropy tends to be lower. Before 1960, the different entropies roughly track each other. After 1960, name entropy grew much faster than phonetic entropy. The gap between them is likely explained by "creative spelling" — Caitlin, Kaitlyn, Katelyn; Brian, Bryan, Bryon. The modern boom in distinct names appears to be largely orthographic, not phonetic.
Name half-life
Not only have the most popular names been covering a smaller percentage of births over time, but the top names themselves have been cycling faster and faster. In the 1880s, the top 10 names took 45 years to drop to half their peak share. By the 1990s, the half life is less than 20 years.
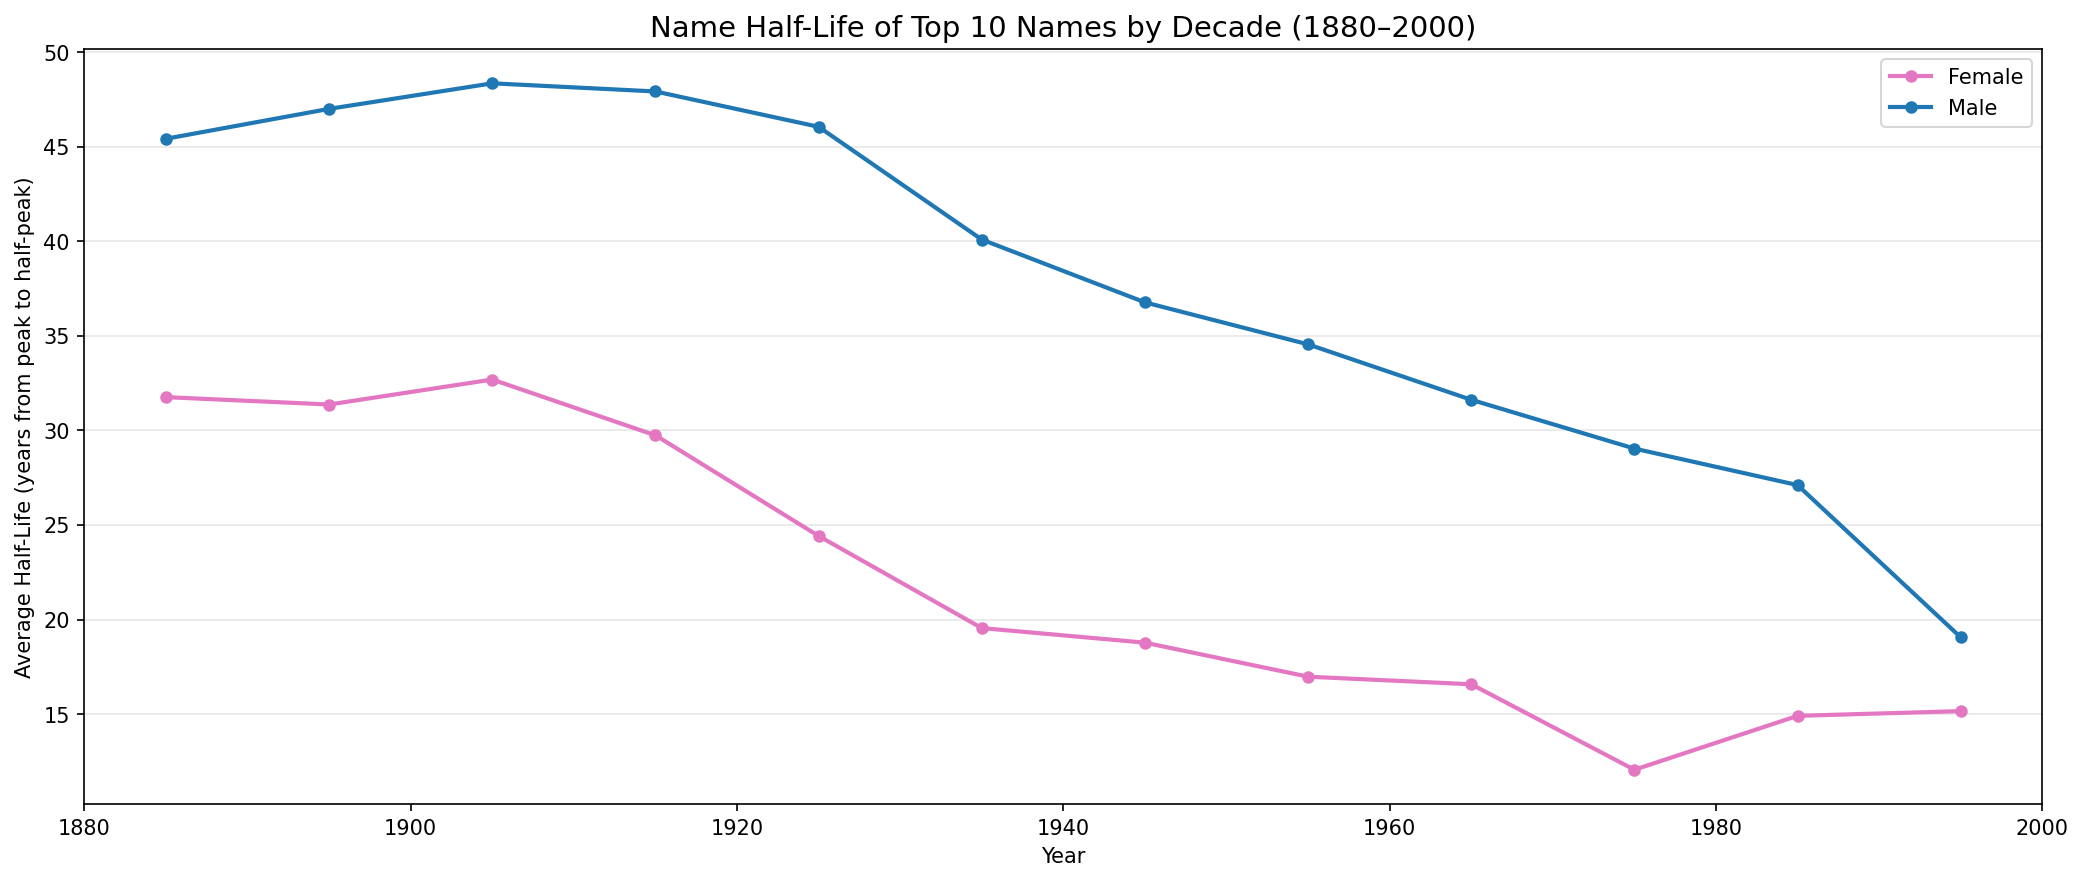
- Male top names have always lasted longer: In the 1880s, male top-10 half-life was ~45 years vs. ~32 for females.
- The gap is narrowing: 13-year male-female gap in the 1880s → 4 years by the 1990s.
- Chart cuts off at the 1990s because newer names haven't finished decaying yet.
Why?
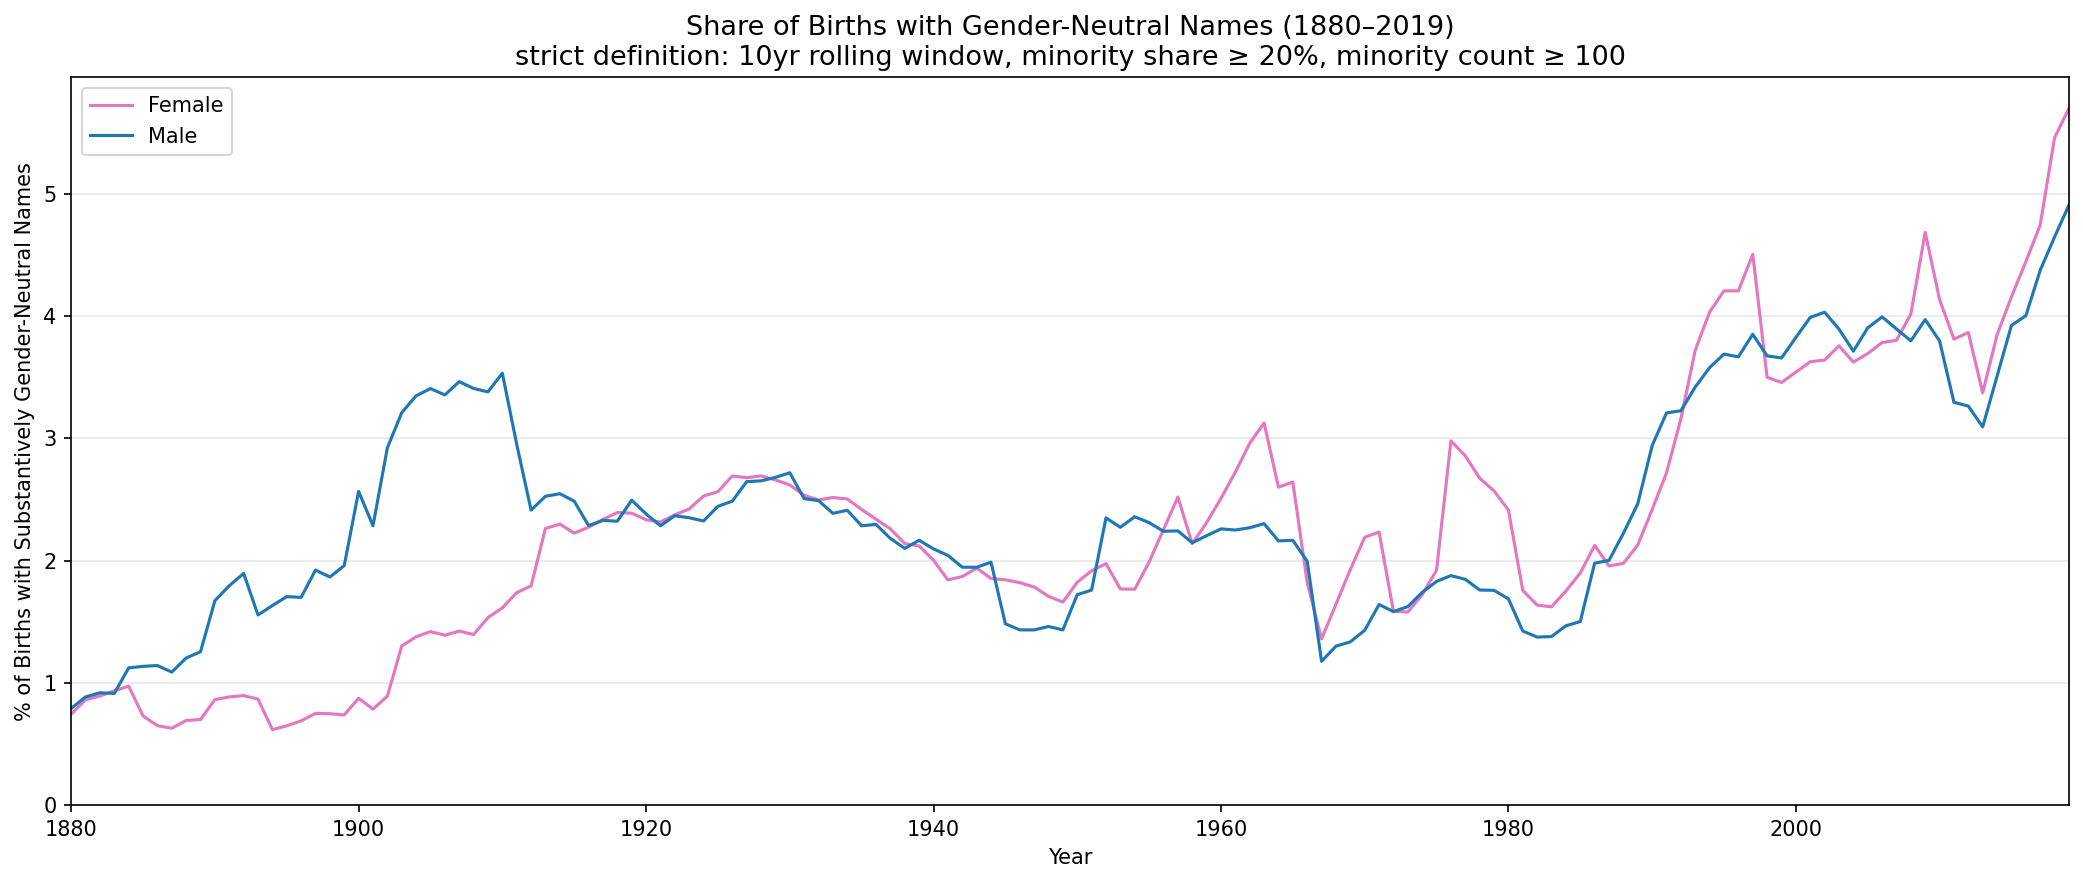
Gender-neutrality doesn't feel like it should be a permanent label — a name has to requalify every year. A name that reads strongly one gender today might have been gender-neutral decades ago, and a brief past qualification shouldn't make the name gender-neutral forever. The rolling multi-year window helps smooth out single-year noise so a one-off blip doesn't flip a name in or out.
Why 20%? In 2024, Liam was the most popular name amongst boys (22K births), but Liam was also given to 500 girls — a 1 : 49 ratio. Does that make Liam a gender-neutral? Most people seem to say no. But where is the line? 5%? 20%? 40%? An informal poll of a small friend group found that most respondents consider a 20% minority-gender share to be a meaningful indicator of cross-gender use.
It's possible to go with a more permissive or restrictive definition. A small one-at-a-time ablation sweep — window $W \in \{1, 5, 10, 15, 20\}$, share $S \in \{0.05, 0.10, 0.20, 0.30, 0.40\}$, count $C \in \{25, 50, 100, 250, 500\}$ — confirms that the broad shape of our findings holds across other reasonable variations.
Gender-neutral naming over time
The share of births going to substantively gender-neutral names has risen ~8× since 1880, from ~0.7% to ~5.5% today. An early-1900s male spike (~3.3% in 1910) was driven almost entirely by "Willie".
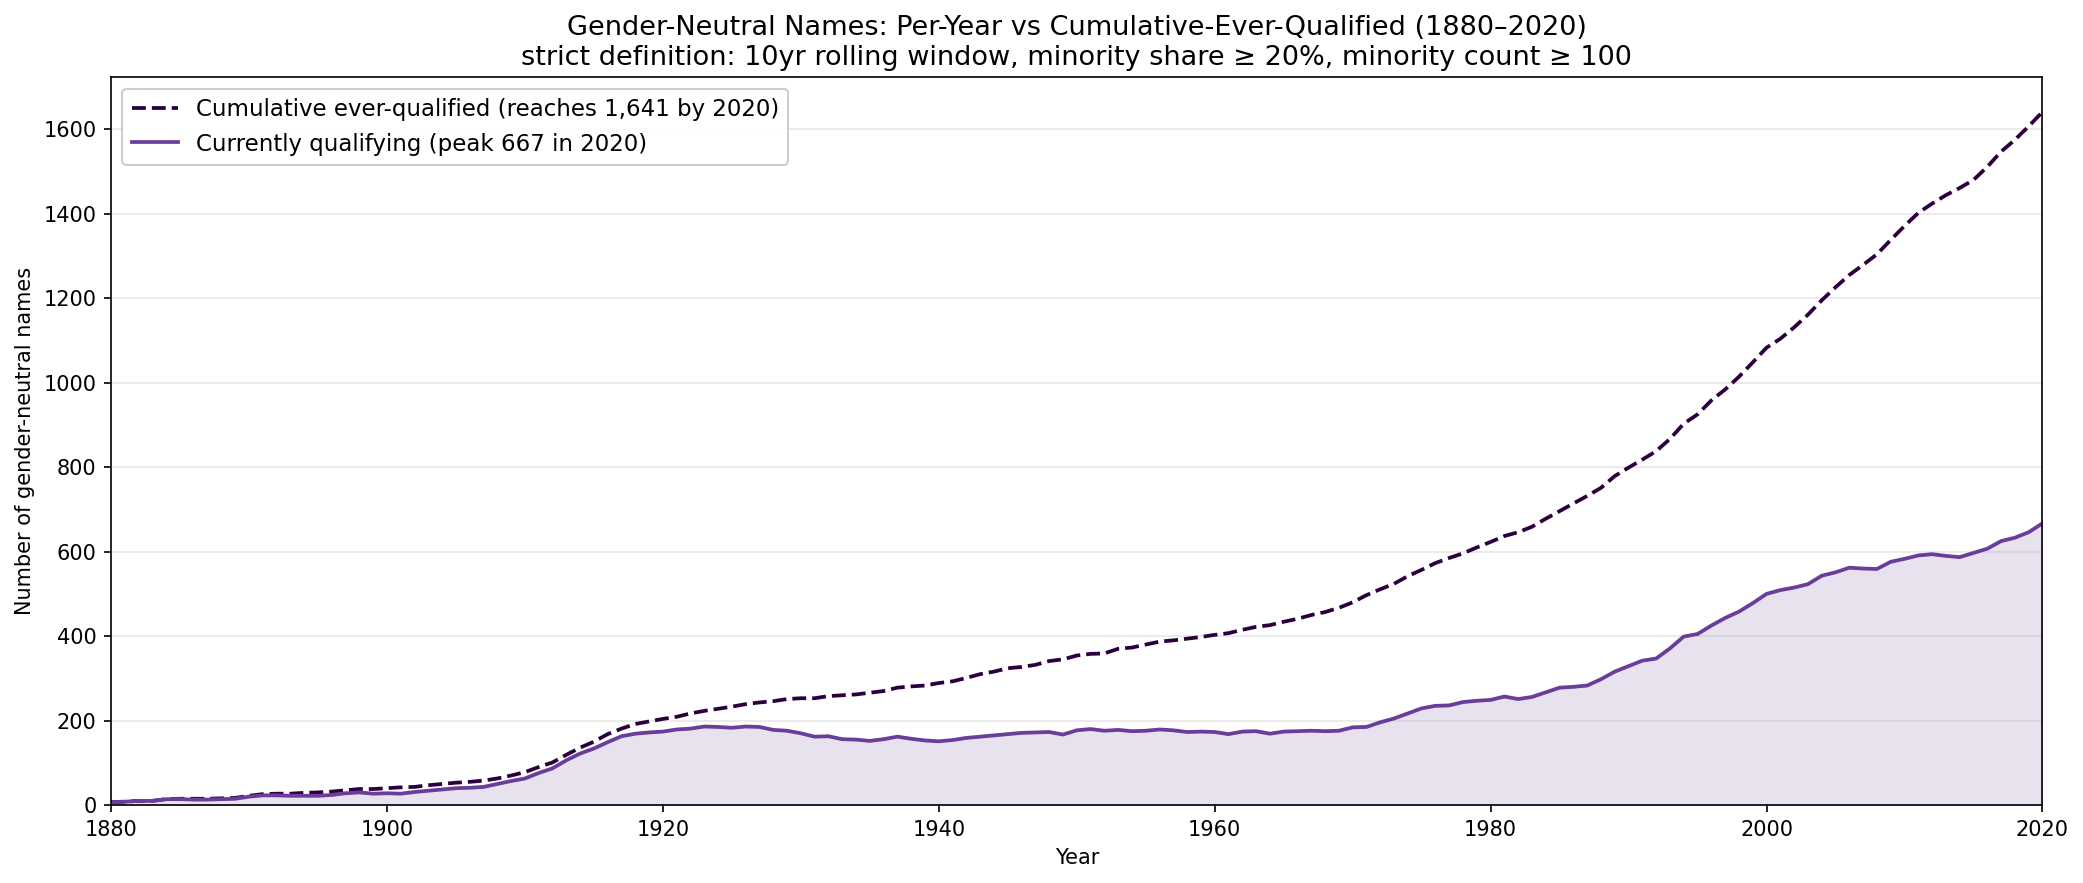
Based on our definition, 1,648 names have ever qualified, and the number of names that are actively qualifying as gender-neutral is on the rise. There's about 1000 names that qualified as gender-neutral in the past but are no longer in use.
The all-time gender-neutral champions
We look at four different ways to rank the 1,669 names that ever met the strict GN gate: Max Prevalence (highest share of US births in a 10-year window during a qualifying year), Balance (closest to 50:50 F/M during qualifying years, restricted to names with ≥10K total qualifying-year births), Longevity (most qualifying years), and Total Usage (most births during qualifying years).
| # | Name | Max Prev | Total | F : M | Yrs-GN | Status |
|---|---|---|---|---|---|---|
| 1 | Willie | 0.708%1906 | 368K | 65 | Active-M | |
| 2 | Taylor | 0.621%1996 | 228K | 29 | Active-GN | |
| 3 | Jordan | 0.551%1995 | 406K | 25 | Active-M | |
| 4 | Terry | 0.471%1957 | 263K | 40 | Active-M | |
| 5 | Jamie | 0.413%1980 | 193K | 87 | Active-GN | |
| 6 | Jessie | 0.387%1903 | 251K | 123 | Active-GN | |
| 7 | Tracy | 0.354%1965 | 105K | 80 | Active-GN | |
| 8 | Shannon | 0.342%1971 | 86.1k | 57 | Active-GN | |
| 9 | Kelly | 0.340%1963 | 84.6k | 19 | Active-GN | |
| 10 | Marion | 0.326%1914 | 234K | 127 | Active-GN |
| # | Name | Max Prev | Total | F : M | Yrs-GN | Status |
|---|---|---|---|---|---|---|
| 1 | Ashton | 0.085%2002 | 29.6k | 22 | Active-M | |
| 2 | Kerry | 0.080%1972 | 97.9k | 85 | Active-M | |
| 3 | Justice | 0.038%2000 | 37.7k | 41 | Active-GN | |
| 4 | Carey | 0.026%1974 | 24.3k | 65 | Active-M | |
| 5 | Kris | 0.030%1965 | 25.8k | 57 | Active-M | |
| 6 | Jean | 0.033%1977 | 22.3k | 49 | Active-GN | |
| 7 | Briar | 0.029%2025 | 13.2k | 37 | Active-GN | |
| 8 | Landry | 0.016%2017 | 10.9k | 33 | Active-GN | |
| 9 | Loren | 0.018%1988 | 19.4k | 50 | Active-GN | |
| 10 | Jaylin | 0.026%2006 | 19.6k | 37 | Active-GN |
| # | Name | Max Prev | Total | F : M | Yrs-GN | Status |
|---|---|---|---|---|---|---|
| 1 | Tommie | 0.039%1934 | 52.2k | 144 | Active-GN | |
| 2 | Marion | 0.326%1914 | 234K | 127 | Active-GN | |
| 3 | Jessie | 0.387%1903 | 251K | 123 | Active-GN | |
| 4 | Ollie | 0.146%1884 | 45.6k | 120 | Active-GN | |
| 5 | Alva | 0.036%1884 | 19.1k | 114 | Active-F | |
| 6 | Sammie | 0.022%1935 | 22.1k | 113 | Active-GN | |
| 7 | Trinidad | 0.010%1921 | 9.4k | 110 | Active-M | |
| 8 | Jackie | 0.124%1939 | 169K | 109 | Active-GN | |
| 9 | Ivory | 0.009%1907 | 14.1k | 108 | Active-F | |
| 10 | Johnnie | 0.123%1929 | 133K | 102 | Active-GN |
| # | Name | Max Prev | Total | F : M | Yrs-GN | Status |
|---|---|---|---|---|---|---|
| 1 | Jordan | 0.551%1995 | 406K | 25 | Active-M | |
| 2 | Willie | 0.708%1906 | 368K | 65 | Active-M | |
| 3 | Terry | 0.471%1957 | 263K | 40 | Active-M | |
| 4 | Jessie | 0.387%1903 | 251K | 123 | Active-GN | |
| 5 | Marion | 0.326%1914 | 234K | 127 | Active-GN | |
| 6 | Riley | 0.236%2008 | 233K | 38 | Active-GN | |
| 7 | Taylor | 0.621%1996 | 228K | 29 | Active-GN | |
| 8 | Angel | 0.316%2006 | 214K | 57 | Active-M | |
| 9 | Jamie | 0.413%1980 | 193K | 87 | Active-GN | |
| 10 | Casey | 0.184%1988 | 185K | 58 | Active-GN |
All 1,669 names that ever qualified, with full per-name stats: download CSV.
Stability of gender-neutral names
Once a name clears the gender-neutral bar, does it stay there?
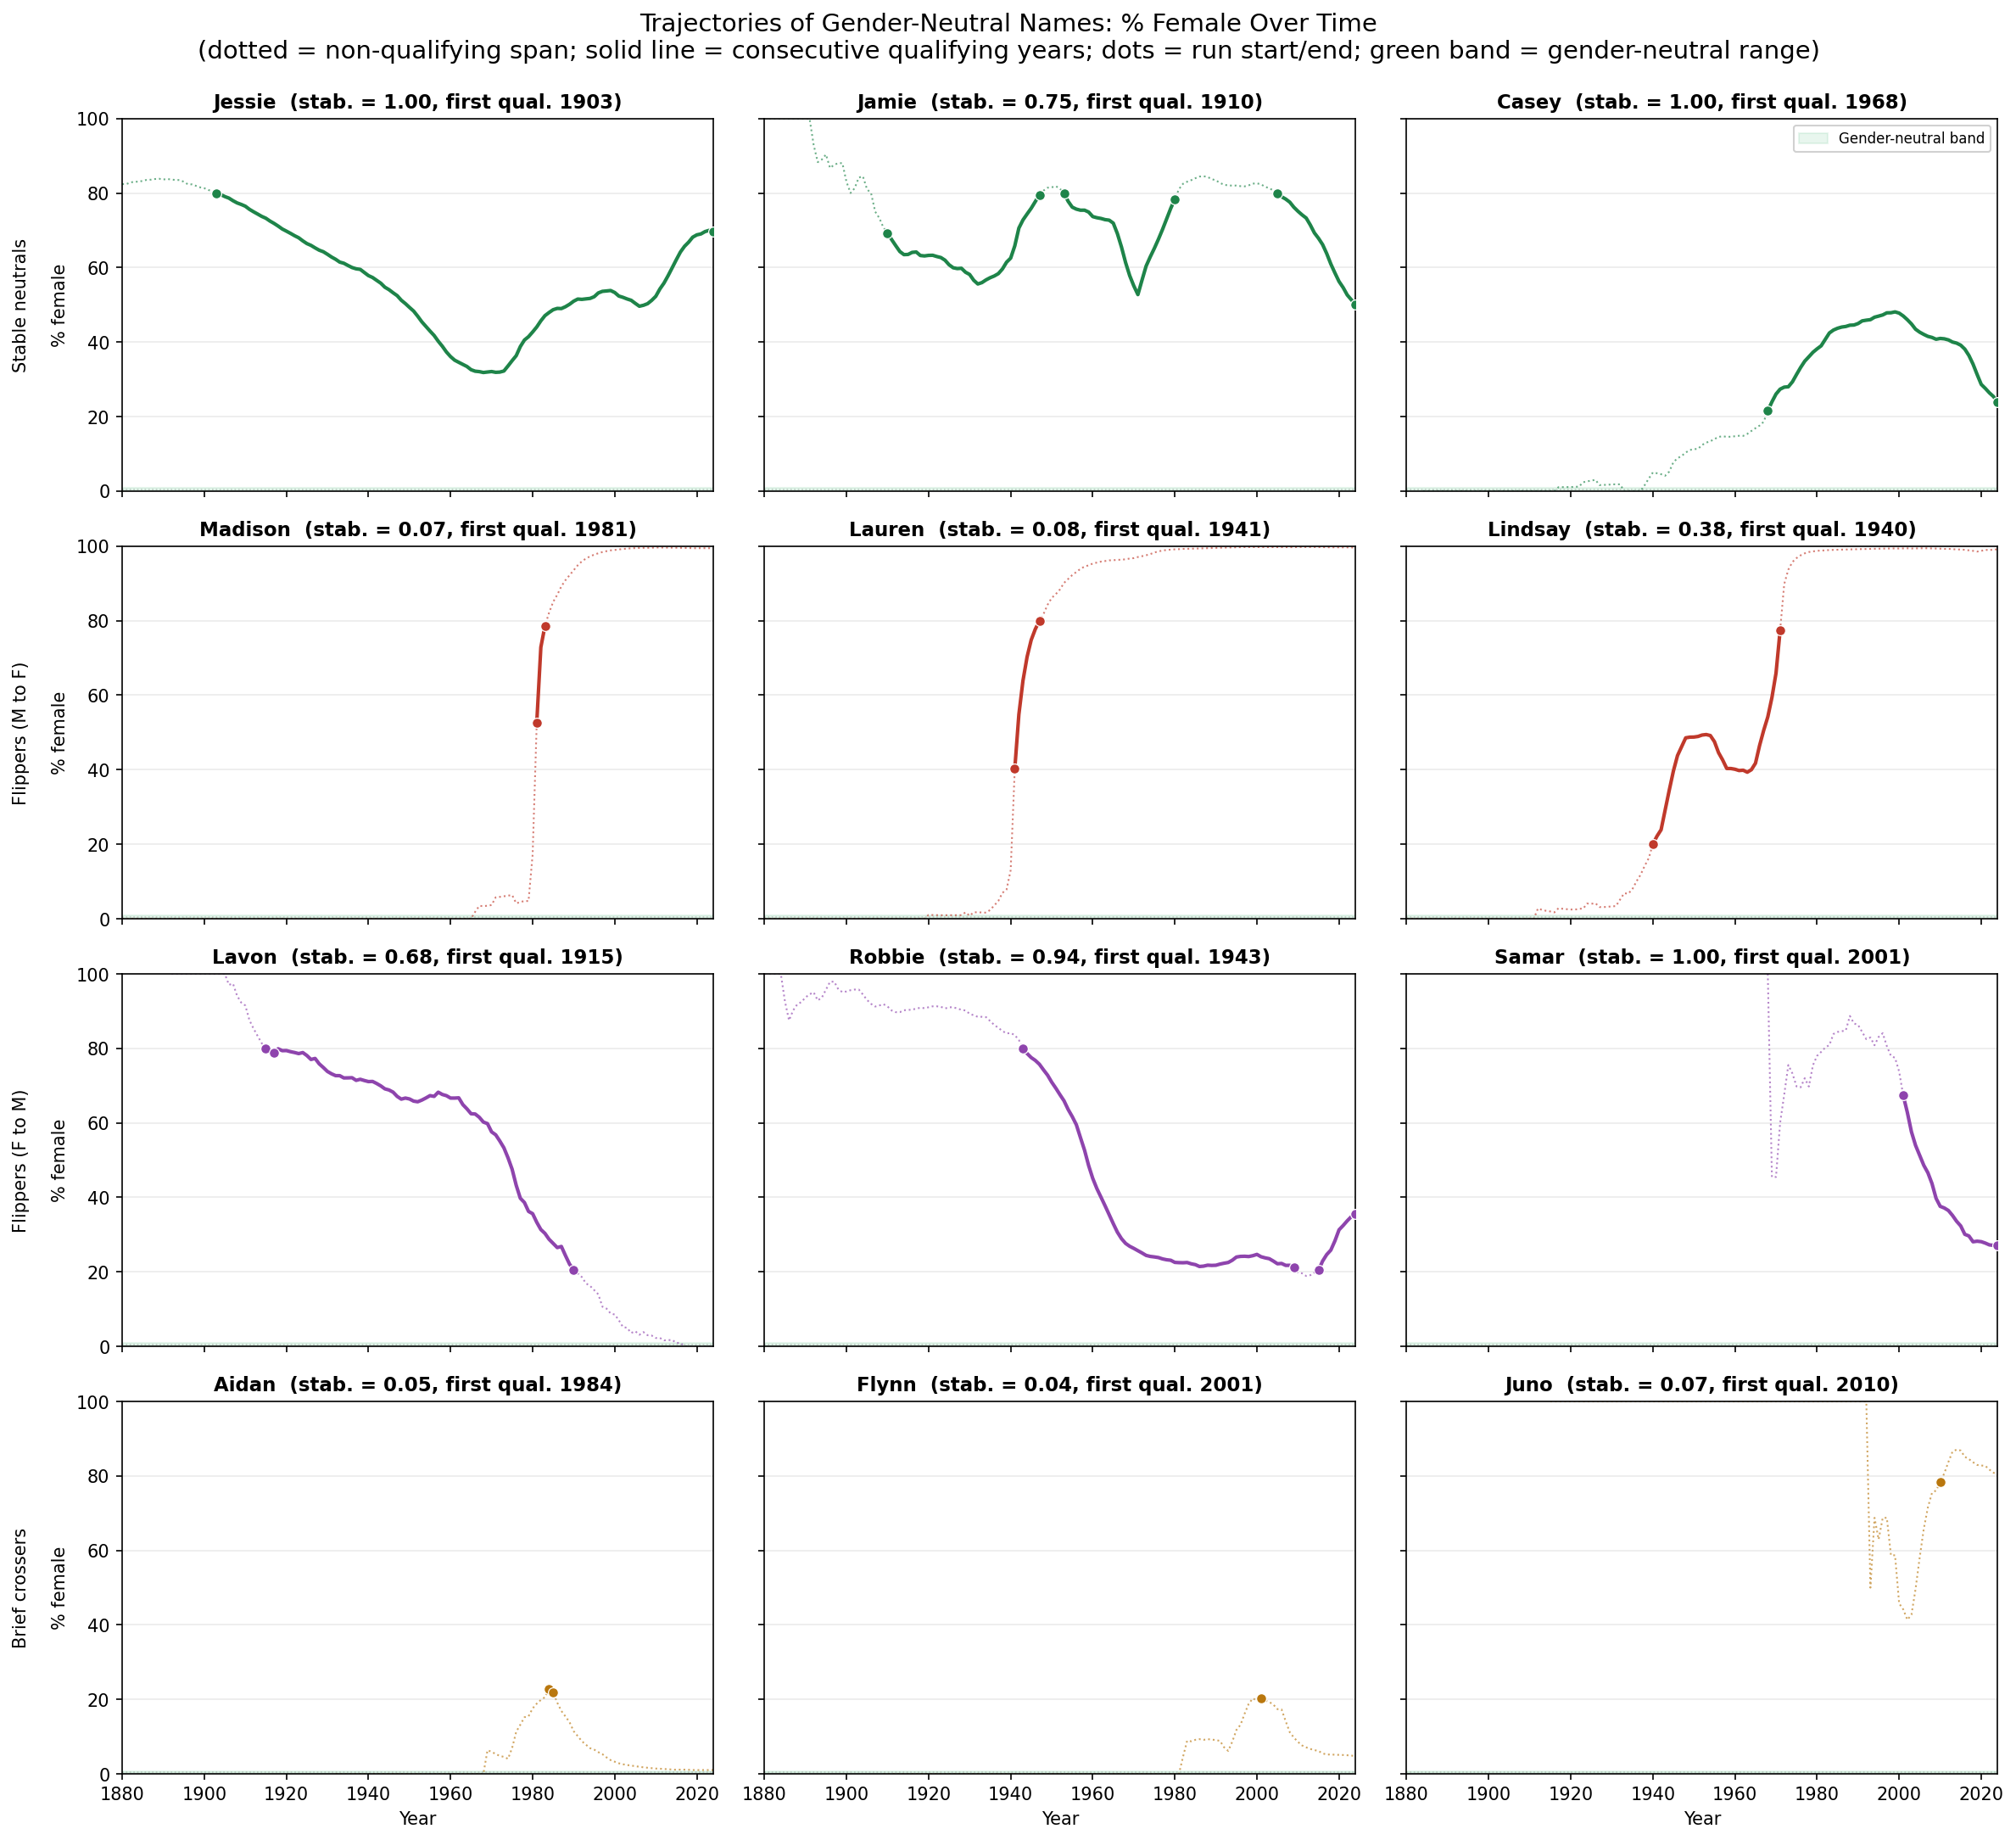
39% are "stable neutrals" (Charlie, Blake, Blake). 25% are "brief crossers" (Jude, Dean, Tristan). The remaining ~36% oscillate. M→F flips are much faster than F→M flips, which play out more slowly.
Where do GN names start, and where do they end up?
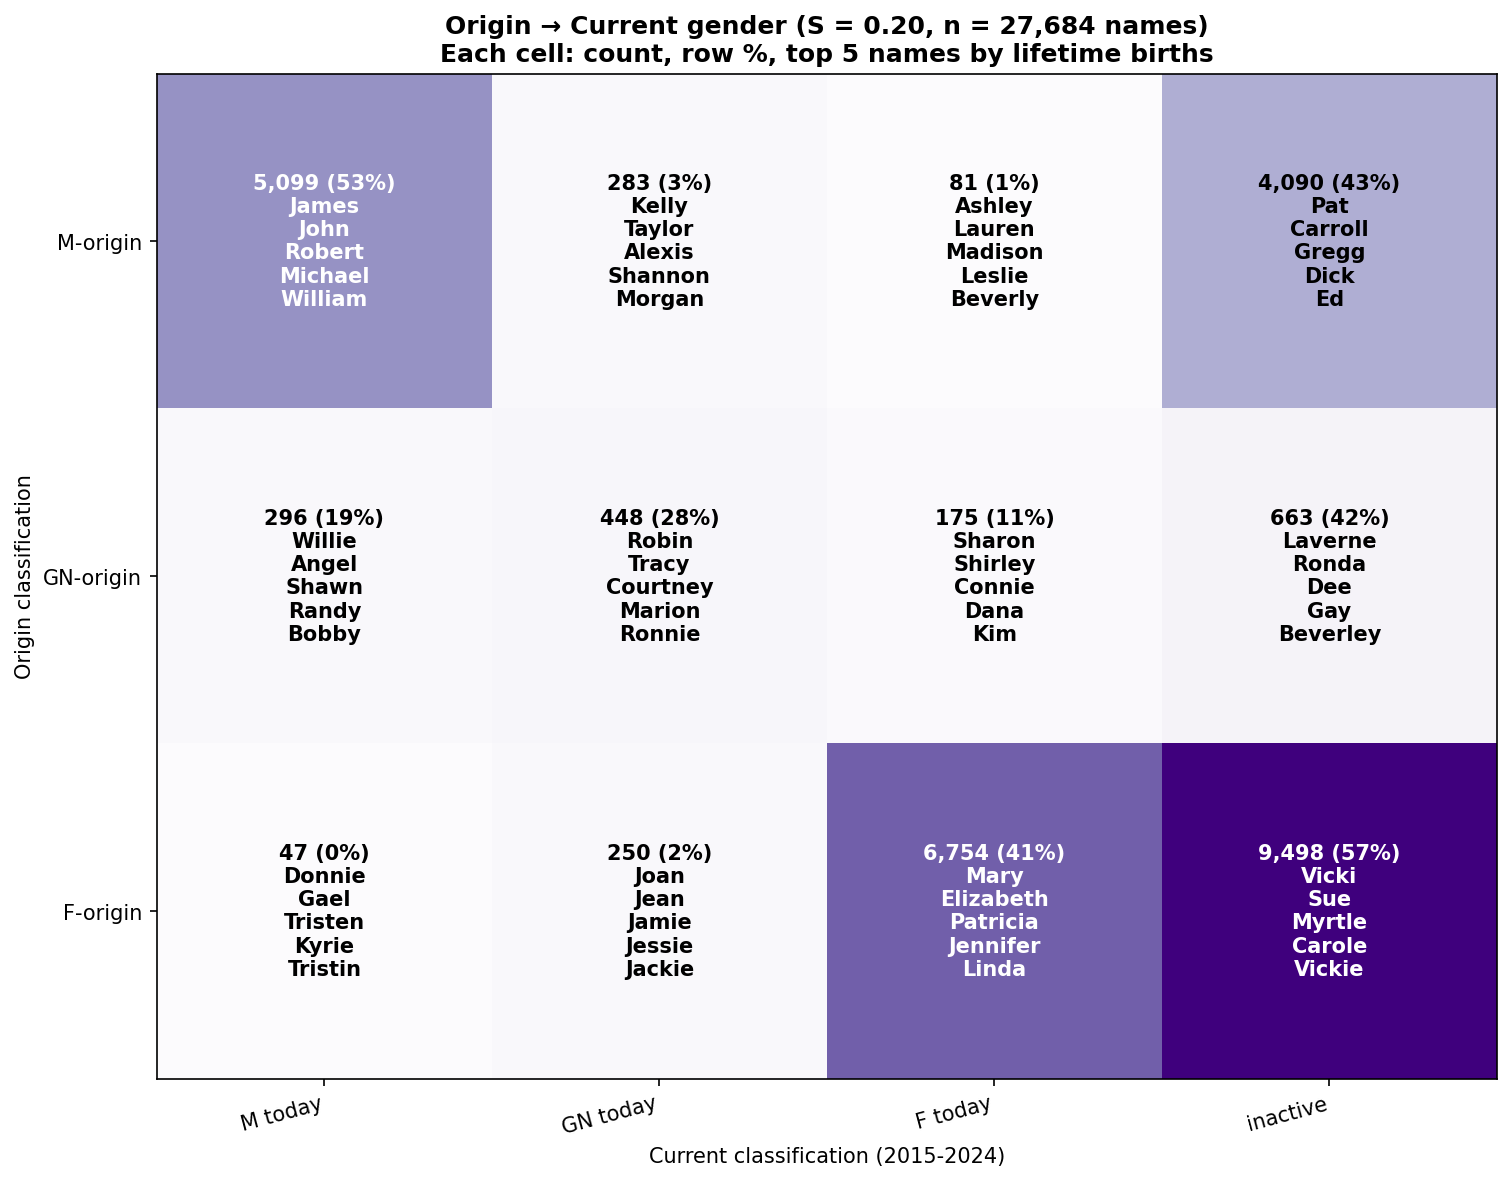
The historical name pool has a high mortality rate. 57% of non-tail F-origin names (9,243 / 16,347) are inactive today — old female-coded staples like Vicki, Sue, Myrtie, Carole. 42% of M-origin names are inactive — Pat, Carroll, Gregg, Dick, Ed. Of 1,557 GN-origin names: 28% still GN, 19% drifted M-dominant, 11% drifted F-dominant, 42% inactive. A handful of names have undergone full gender crossovers: M-origin → F today: 80 names (1%). F-origin → M today: 49 (0.3%).
Ending bigrams as gender signal
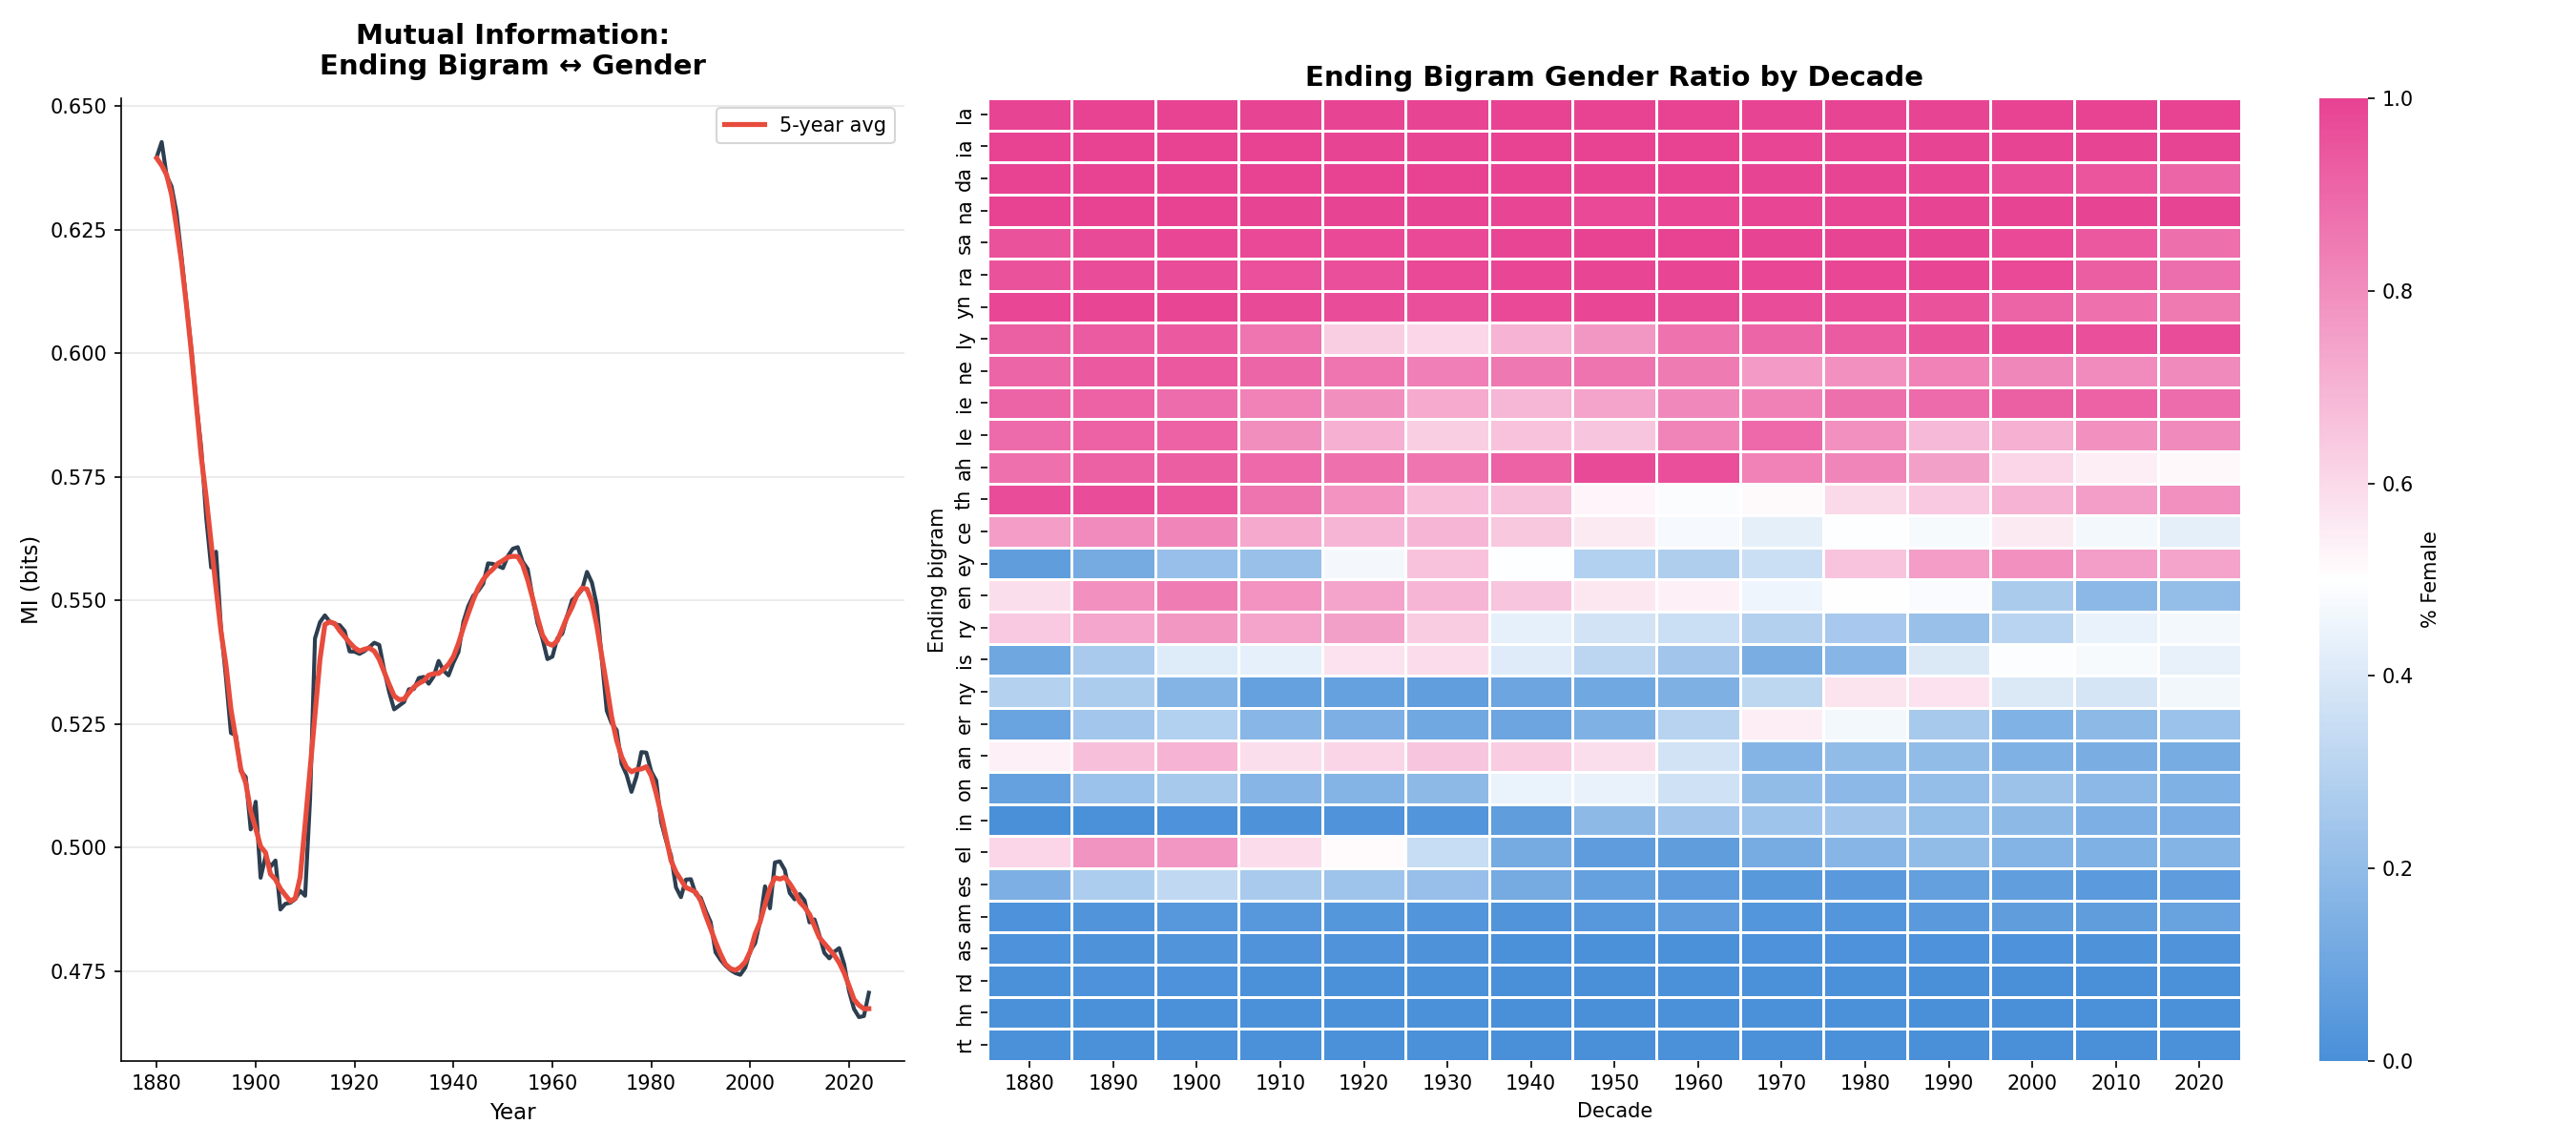
The last two letters of a name carry an outsized share of its gender identity. Mutual information between ending bigram and gender has dropped from 0.64 bits in 1880 to 0.47 bits today — a 27% decline. Endings like -la, -ia, -na stay near-100% female; -rt, -hn, -rd stay near-100% male. Ending bigrams like -ey, -ce, -ah are becoming the most blurred.
Starting-letter frequency
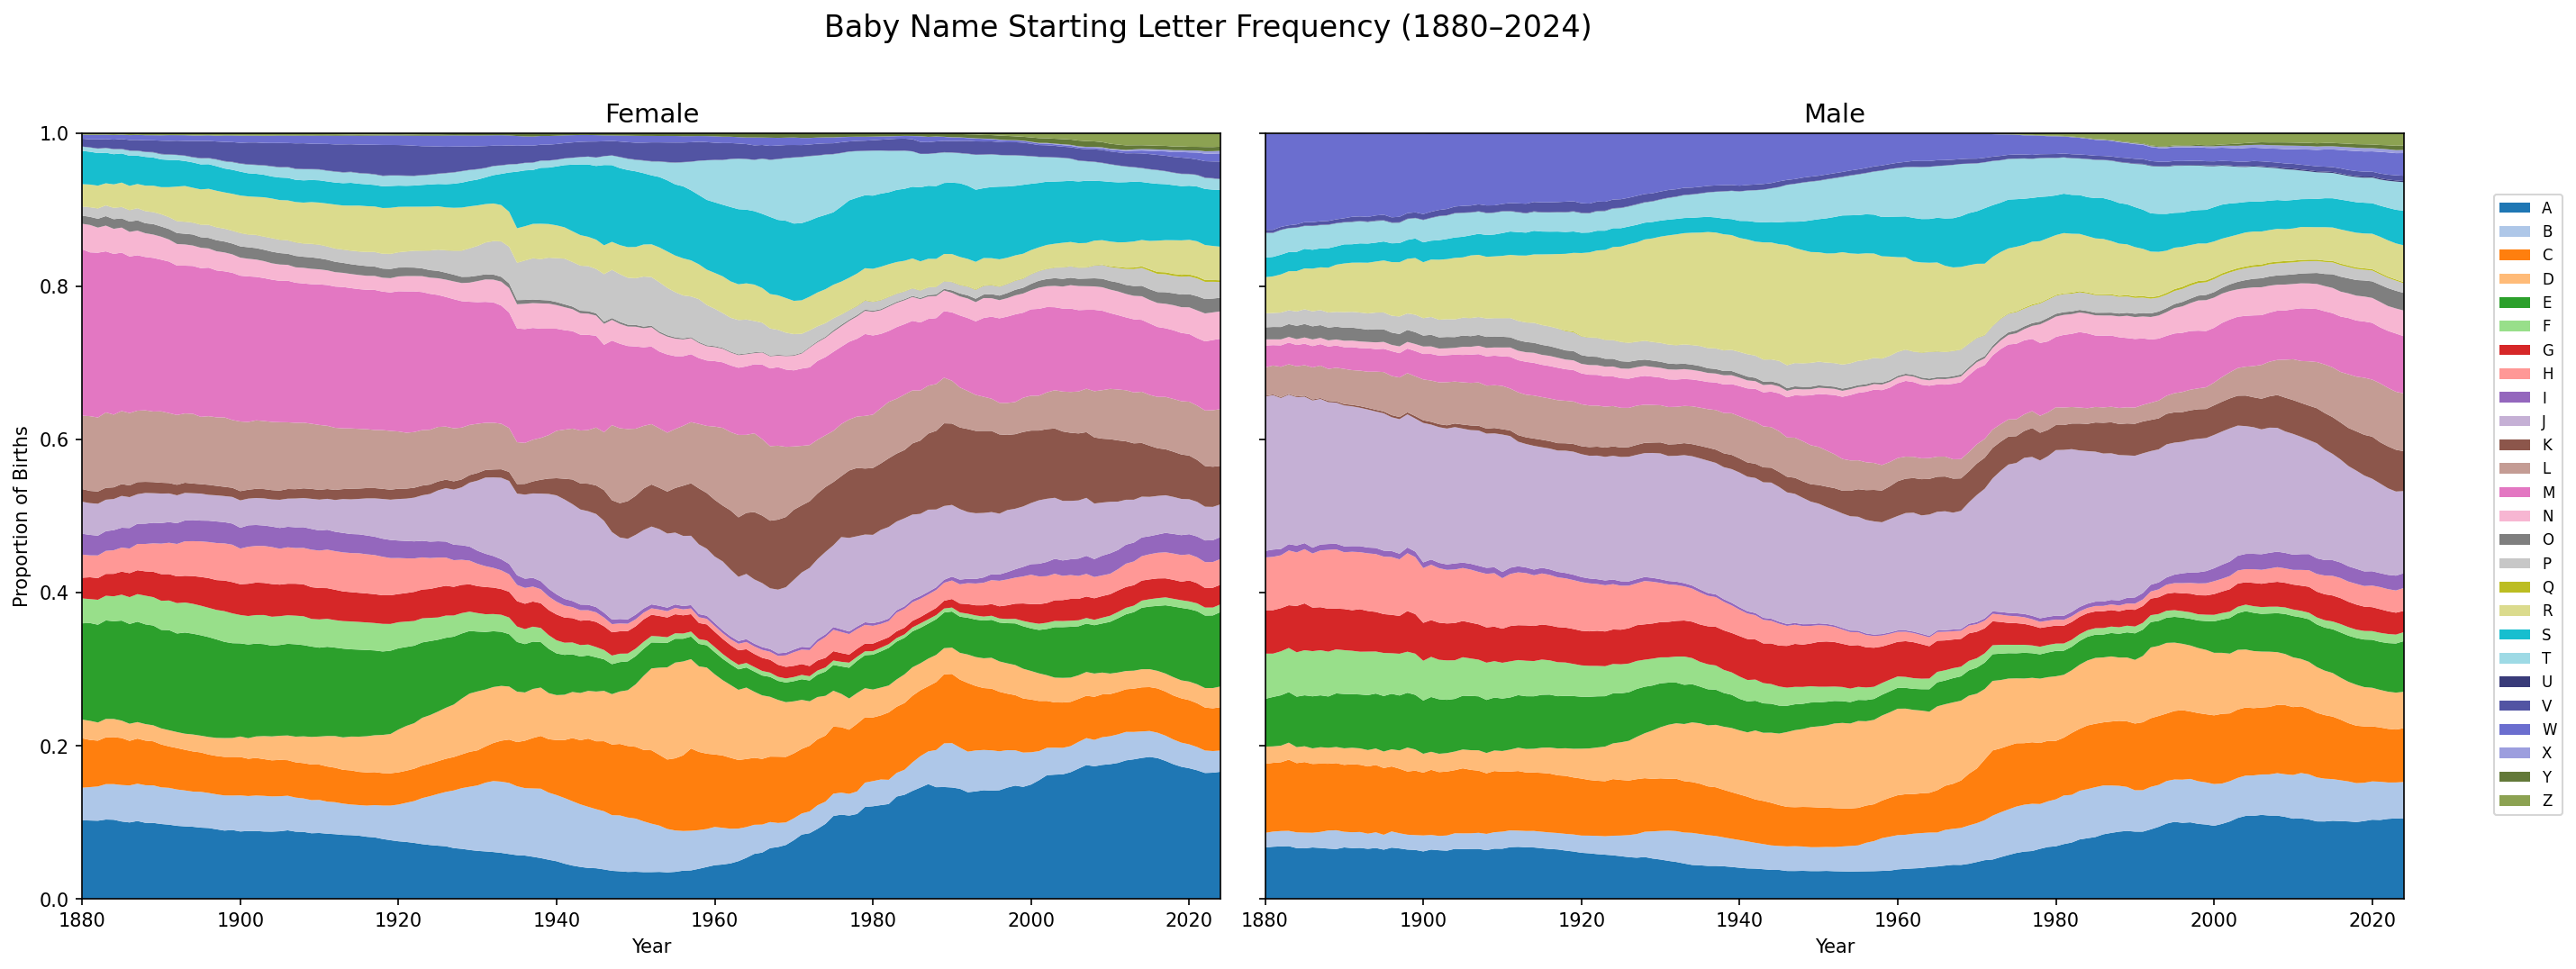
The most dominant starting letter for boy's names is J, but it's also been gradually giving way to other starting letters. Both genders have seen a surge in A-names. M, R, S, and C have been the most consistent and popular starting letters for girls. Starting letters for boy names tend to be more concentrated than for girls.
Starting-letter correlation
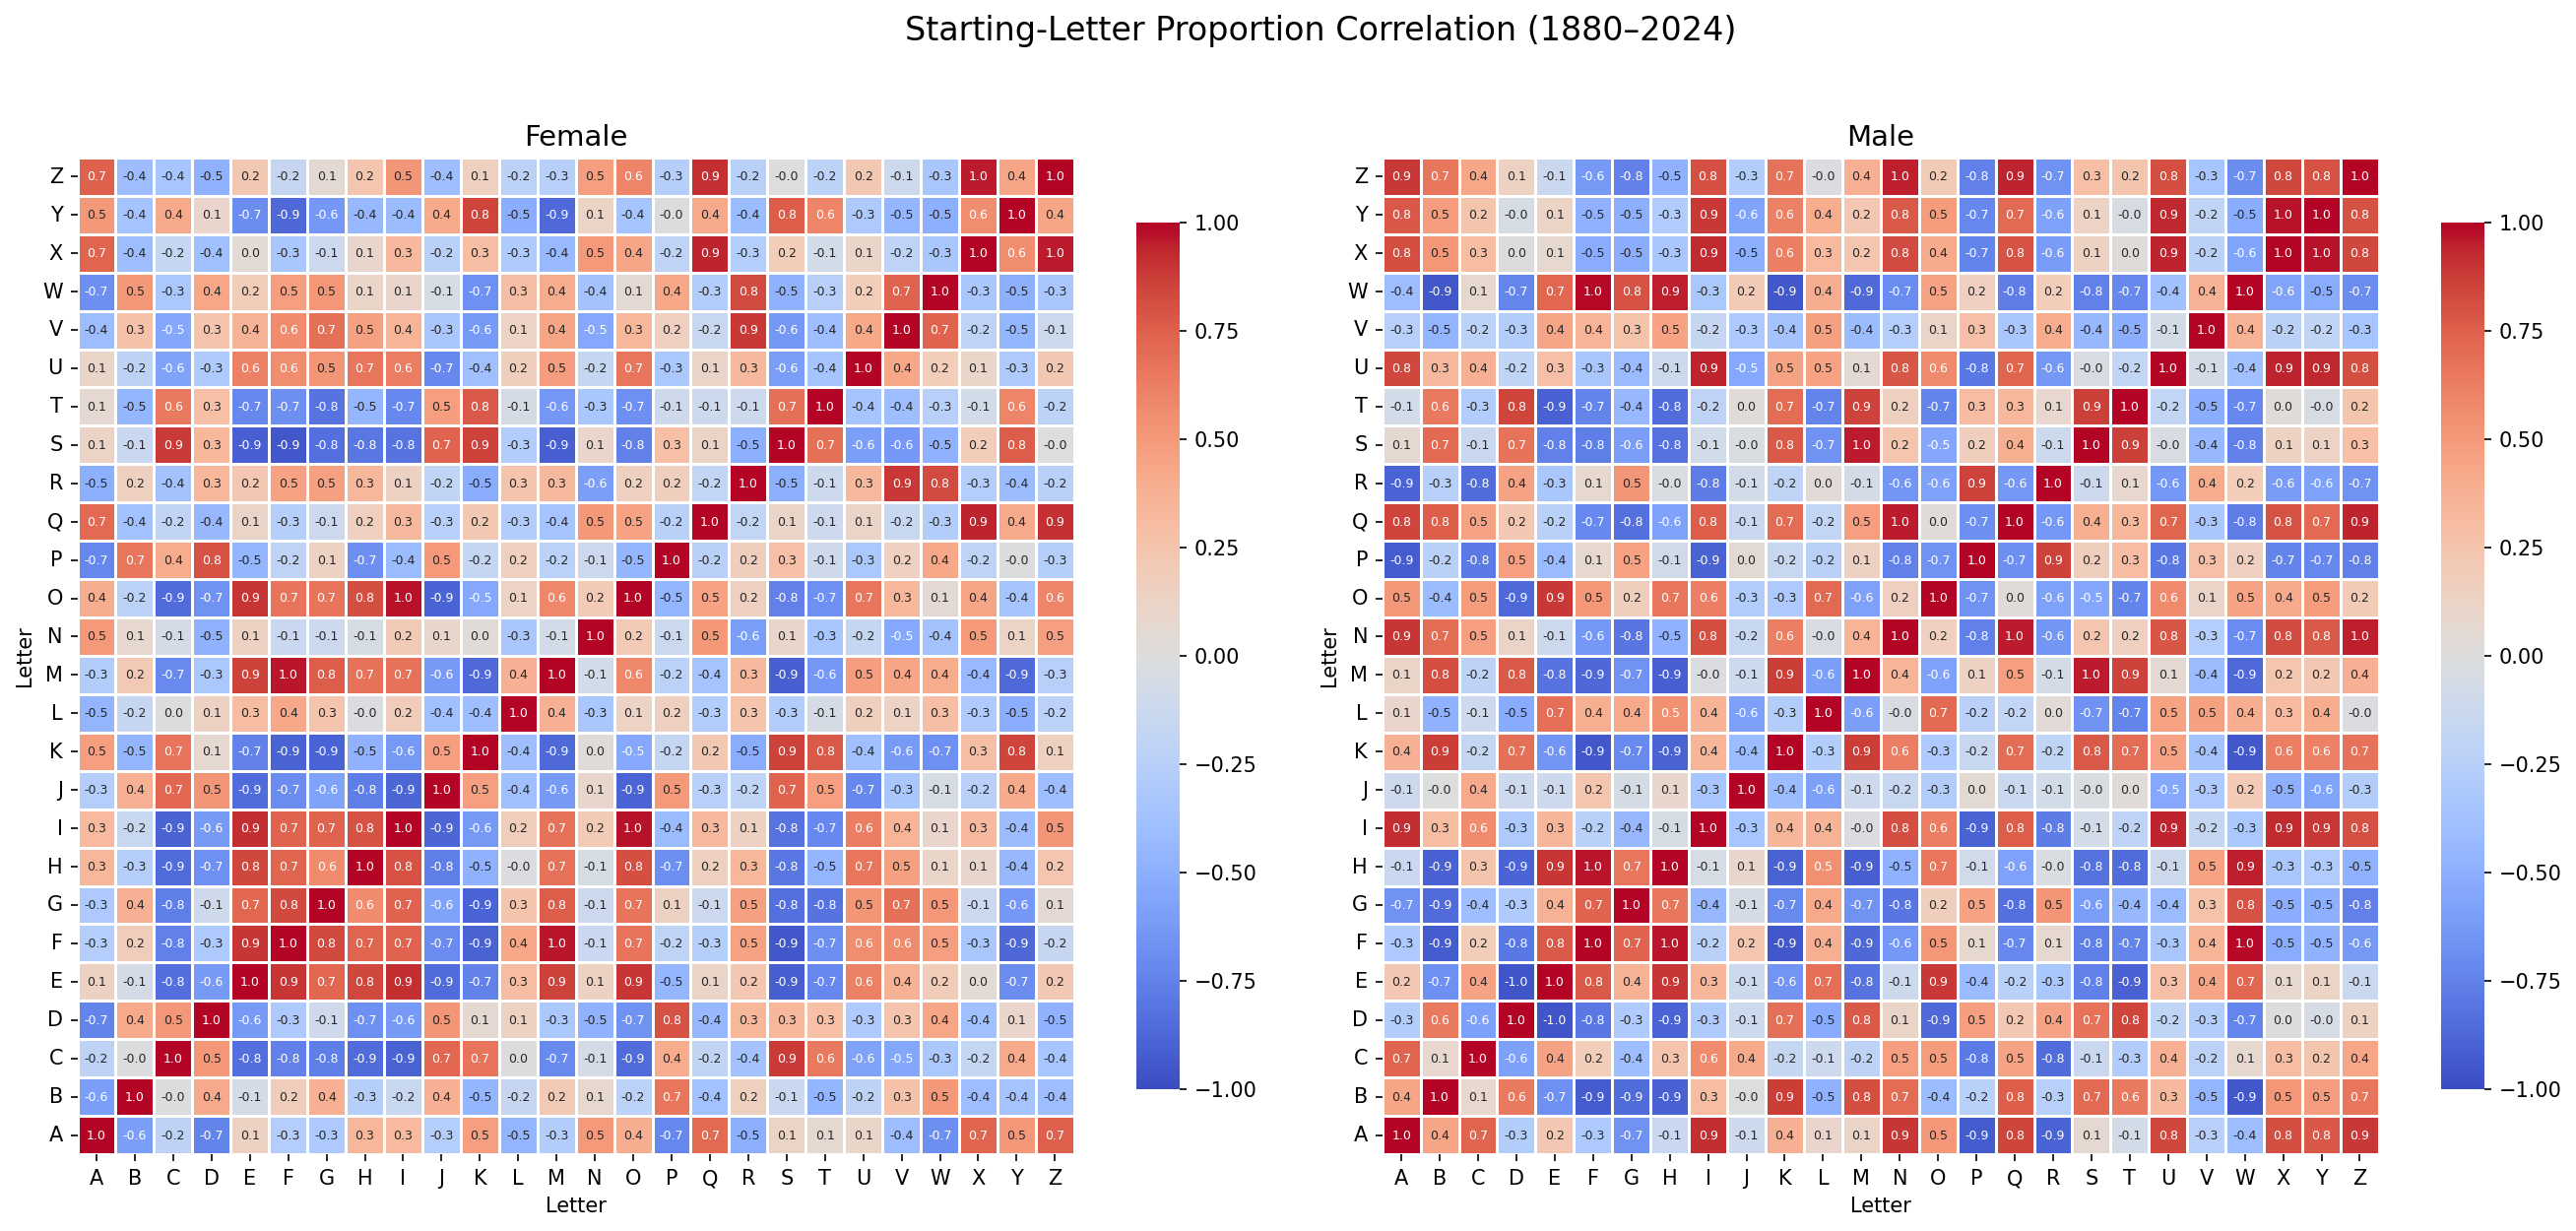
Some starting letters rise and fall together. Others don't. For girls, M and J have strong negative correlations with the A- and K-name waves that replaced it. For males, J, R, W move inversely to A, B, E. Q, U, X, Z show weak correlations with everything probably because they've never been popular enough to participate in large-scale shifts.
Average name length
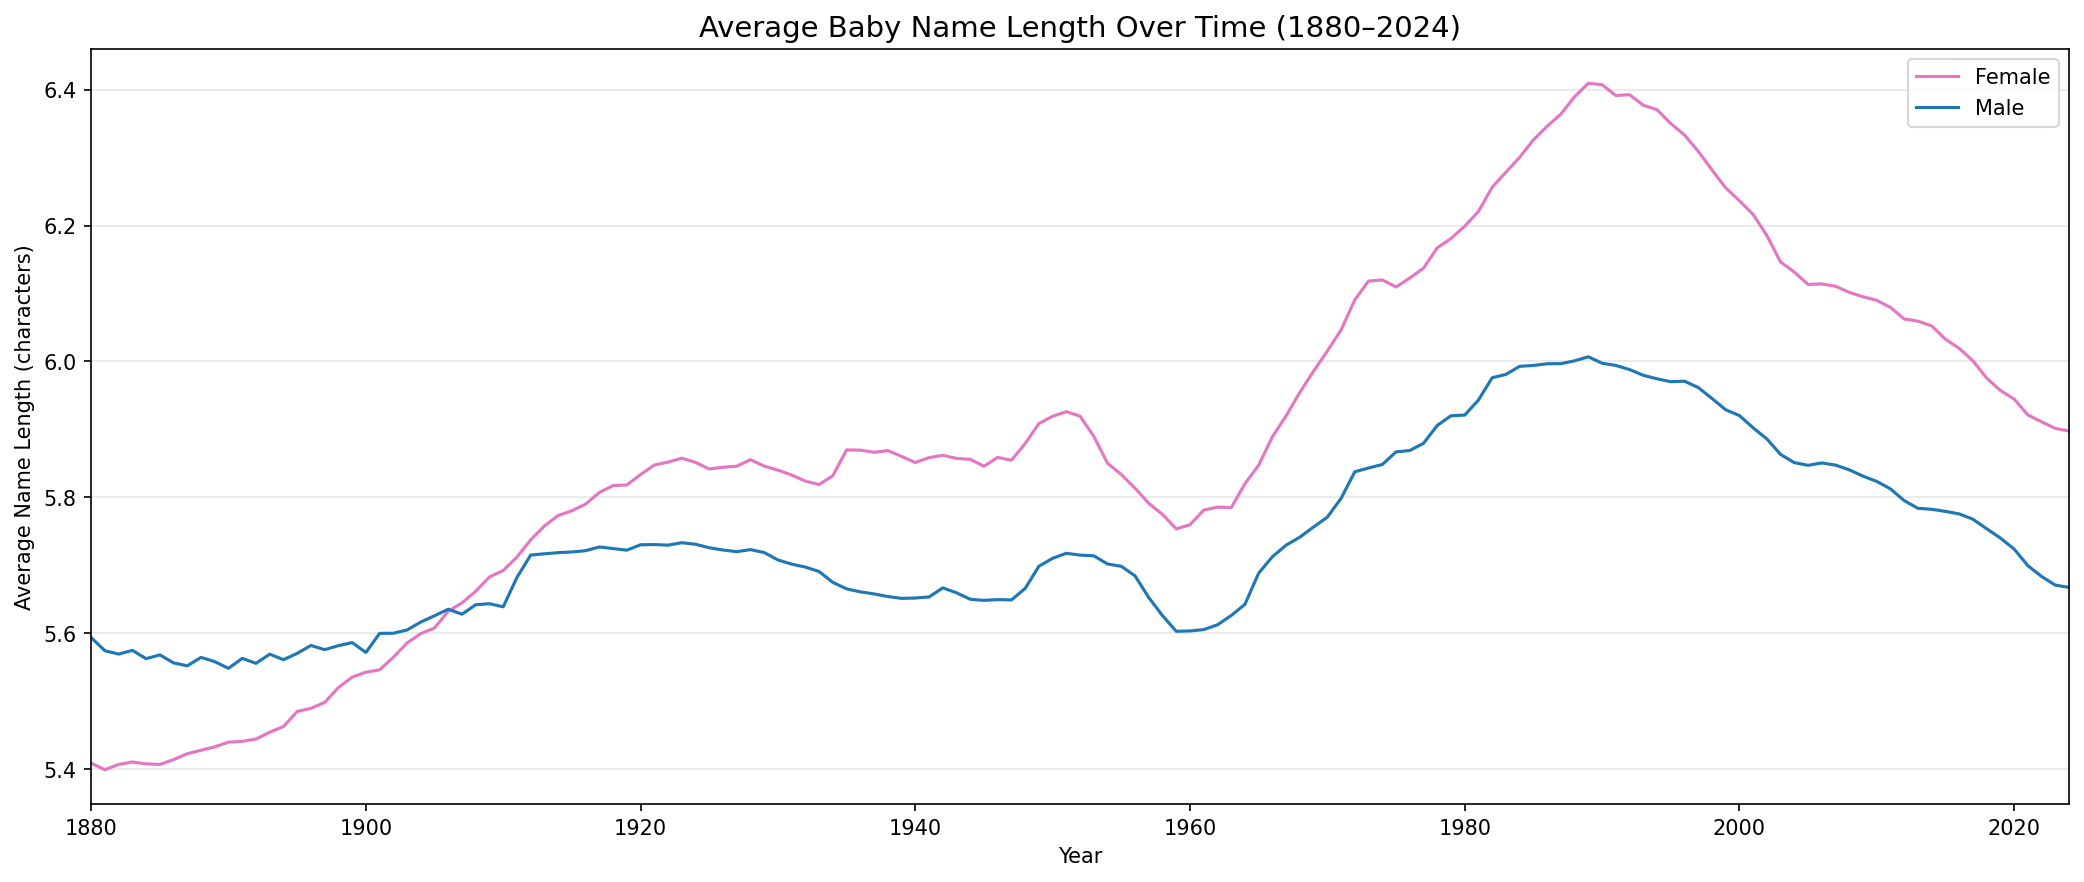
Boy names were briefly longer than girl names from 1880-1905, but girl names have been longer ever since. Length of names peaked in 1990 for both girls (Stephanie, Christina, Jennifer, Samantha) and boys (Christopher/Alexander/Nicholas), and both have been shortening since. The Pearson correlation between boy and girl name length is surprisingly high r = 0.954 (year-over-year changes correlate at r = 0.706).
Character trigram contagion
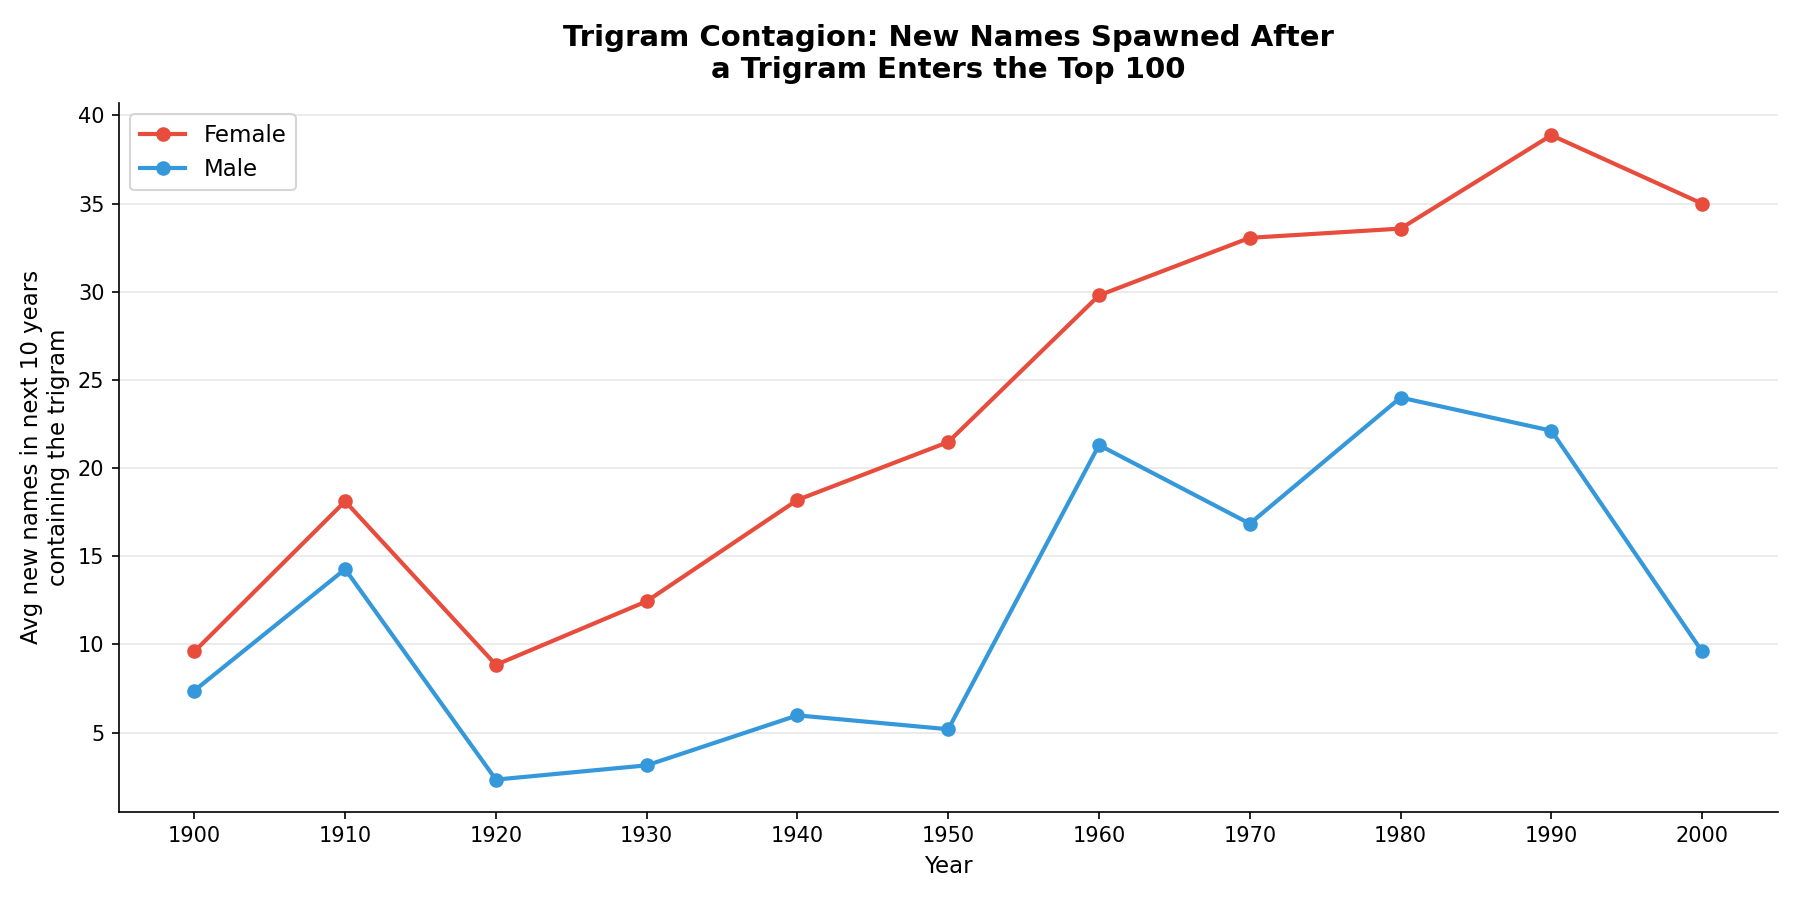
When a trigram appears in a hit name, it tends to spread to brand-new names, particularly for girls. Ashley dominated the 1980s–90s. Then came Paisley, Kinsley, Brinley, Hadley. Jayden spawned Kayden, Brayden, Hayden, Zayden.
Character trigram innovation
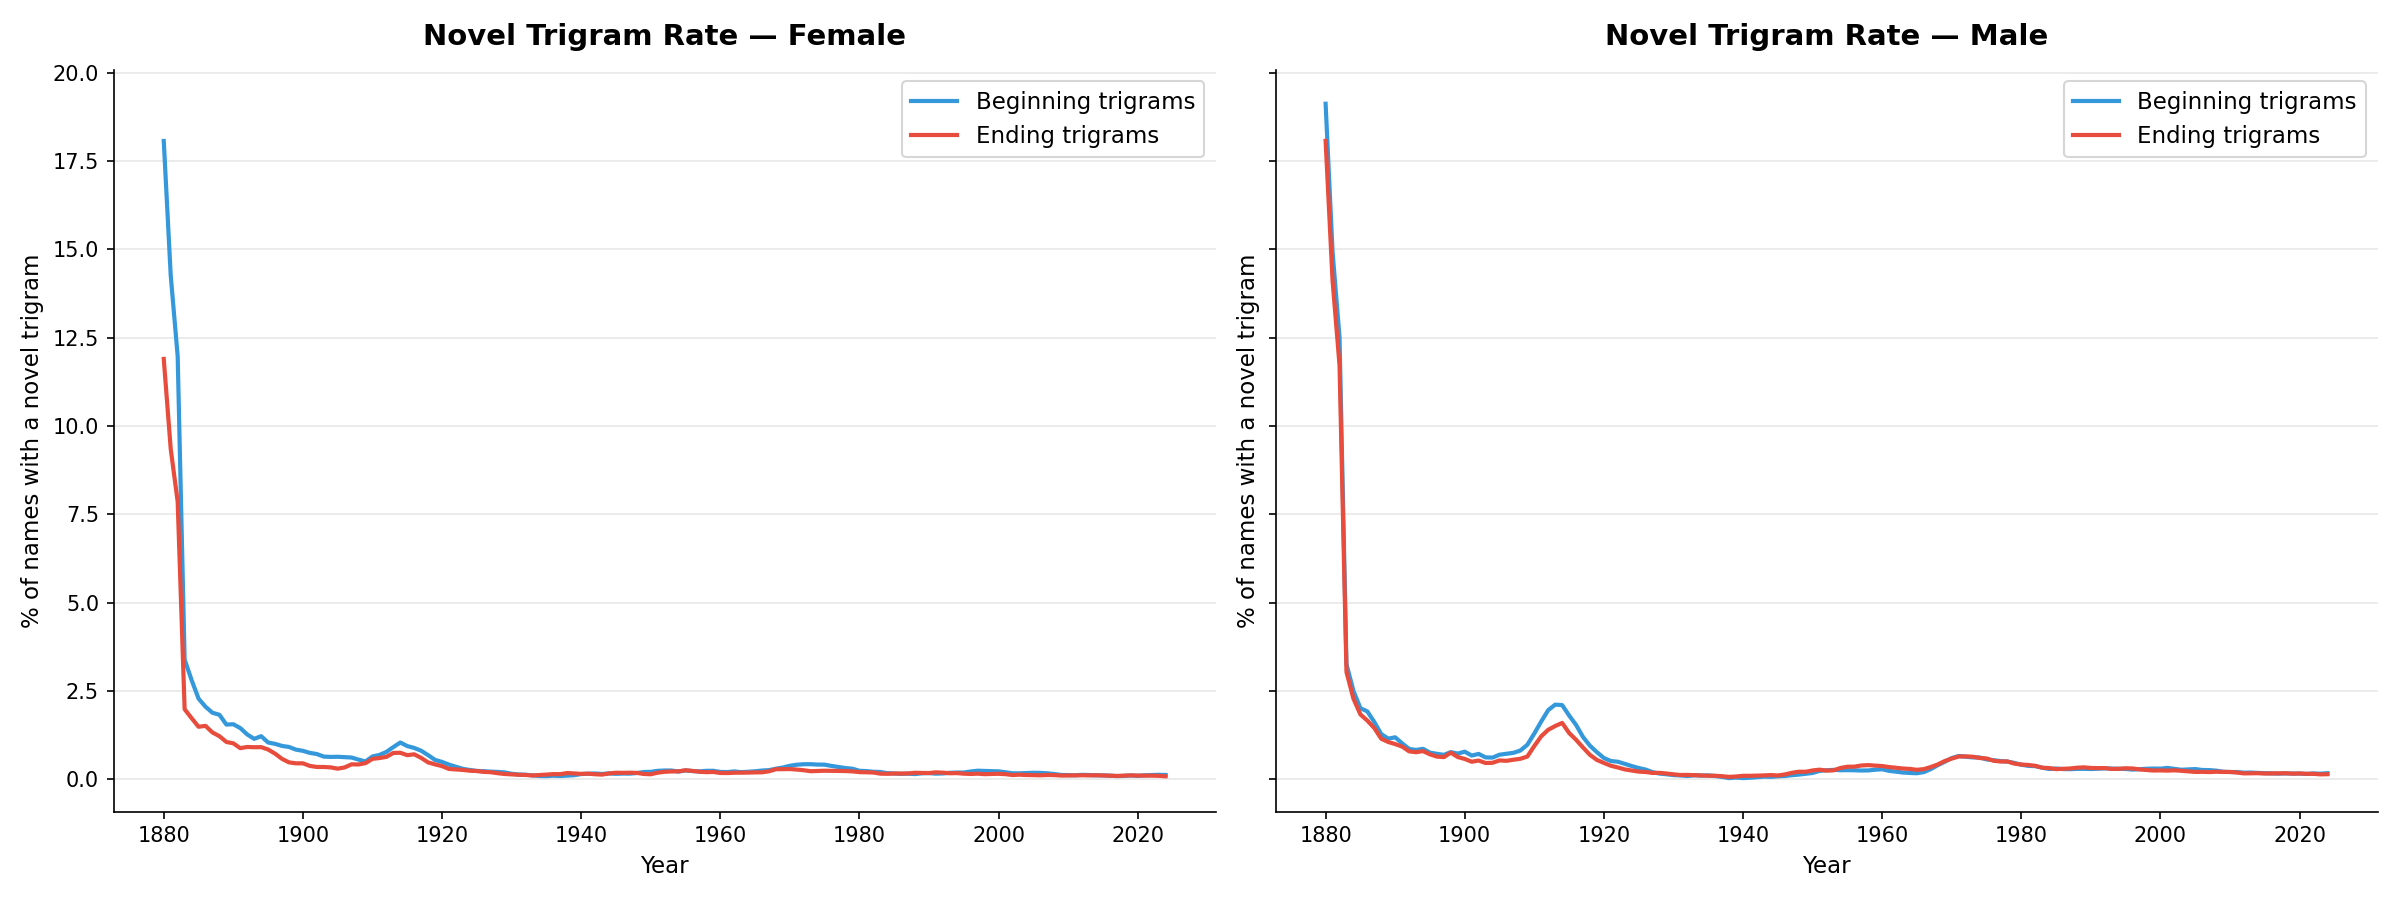
The character trigram space filled up quickly. Novel trigrams dropped to near-zero by the 1920s–30s. Modern creativity appears to be based on recombination of existing trigrams rather than the invention of new ones.
Phonotactic complexity
Girl names have always used more vowels and smoother consonant-vowel alternation. Boy names tolerate more consonant clusters (Chr-ist-opher, Str-ong), though that's starting to change. Boy name phonotactics are converging toward girls: consonant clusters have dropped from 22% to 14%, and vowel sequences (VV) have nearly doubled since 1980.
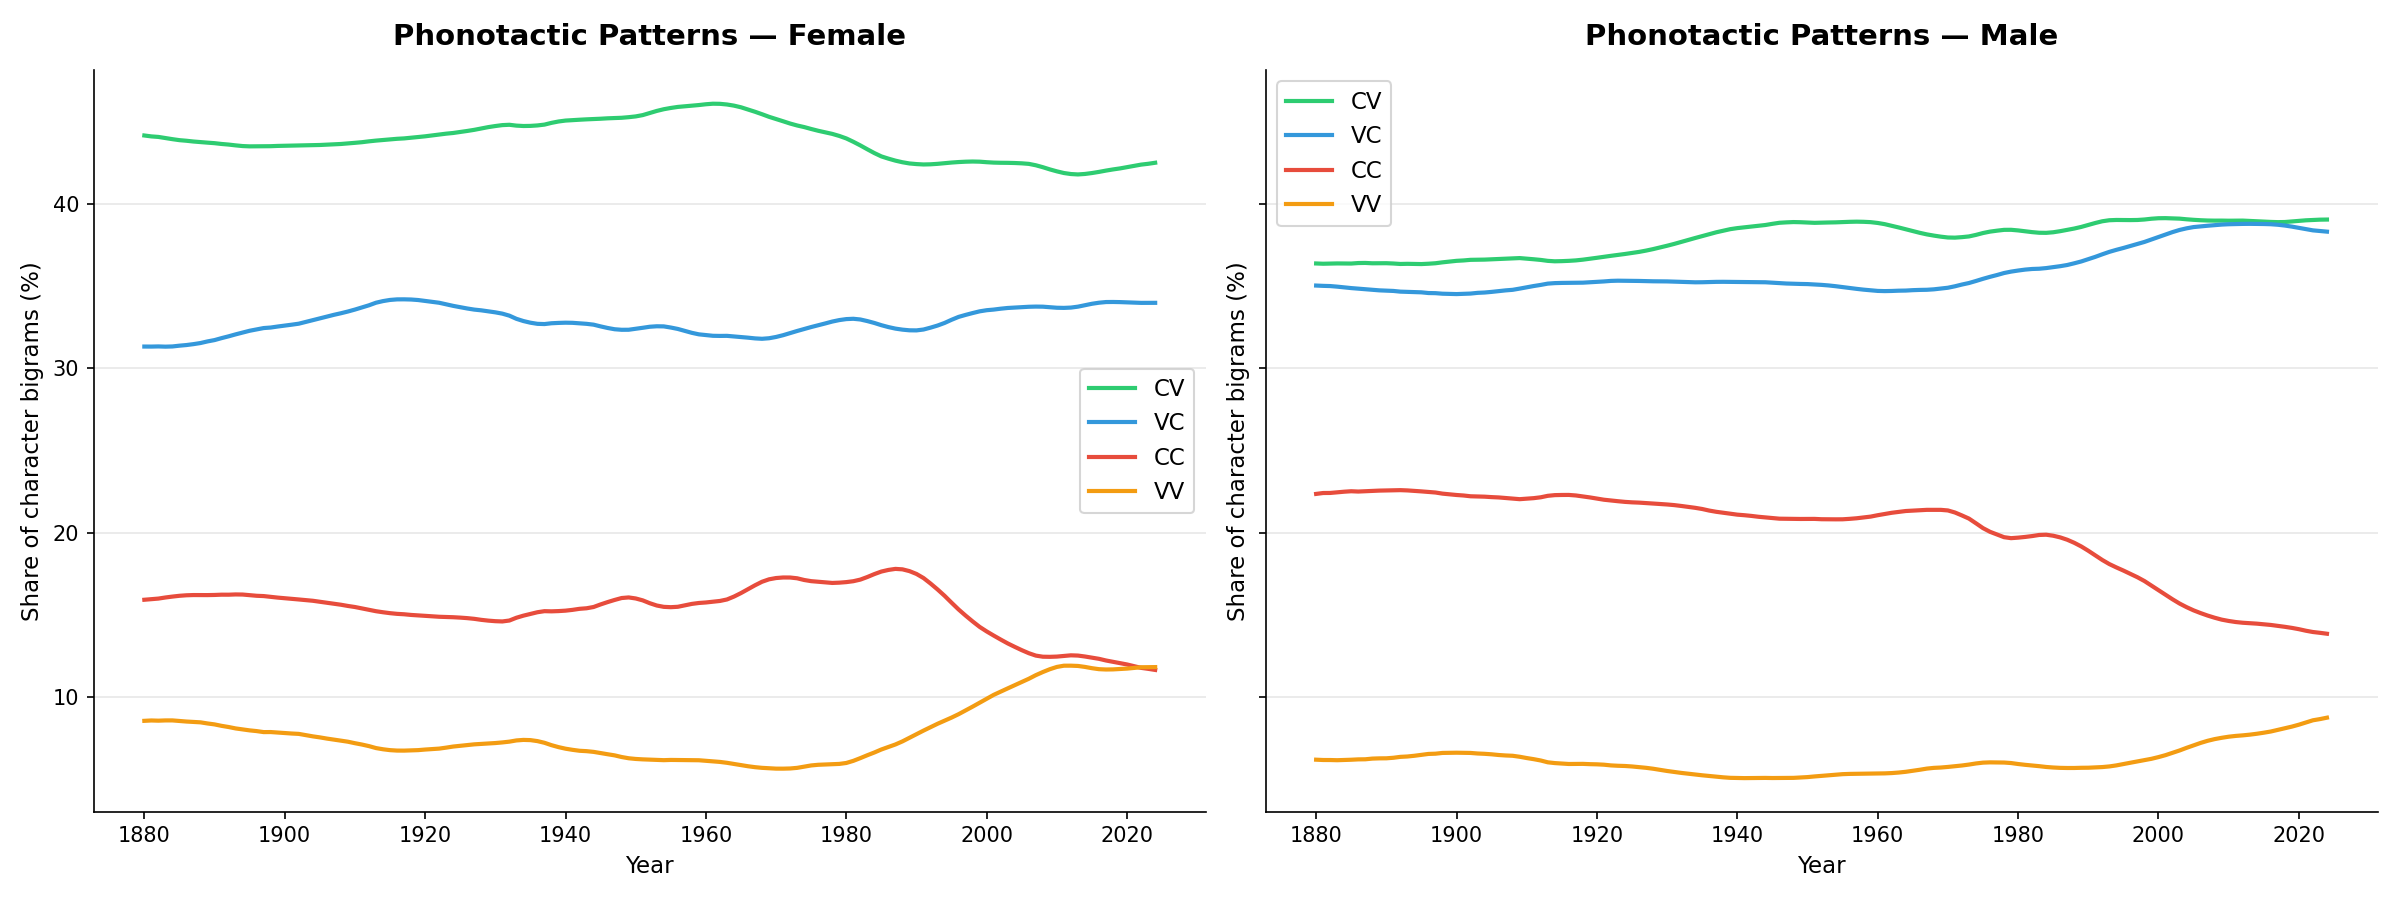
- CV dominates: ~42–46% for females, ~36–39% for males — the Ma-ry, Jo-hn rhythm.
- Consonant clusters are declining: CC fell 16% → 12% (female), 22% → 14% (male).
- Vowel sequences rising: VV share has nearly doubled since 1980 (Mia, Ava, Aria, Noah, Liam, Isaiah).
- Male phonotactics are drifting toward the female pattern with smoother, more vowel-rich phonemes.
Soundex phonetic groups
104,819 names compresses down to ~13,000 Soundex codes. Some phoneme-identical groups are huge: John/Jon (5.4M births), Steven/Stephen (2.2M), Sarah/Sara/Cera (1.5M), Brian/Bryan/Bryon/Brion/Bryen (1.6M). The largest grouping (S050) contains Saaim, Saam, Saamia and ~800 siblings built on the S + long vowel pattern, though this may also be an artifact of the limitations of the Soundex phonetic library we are using.
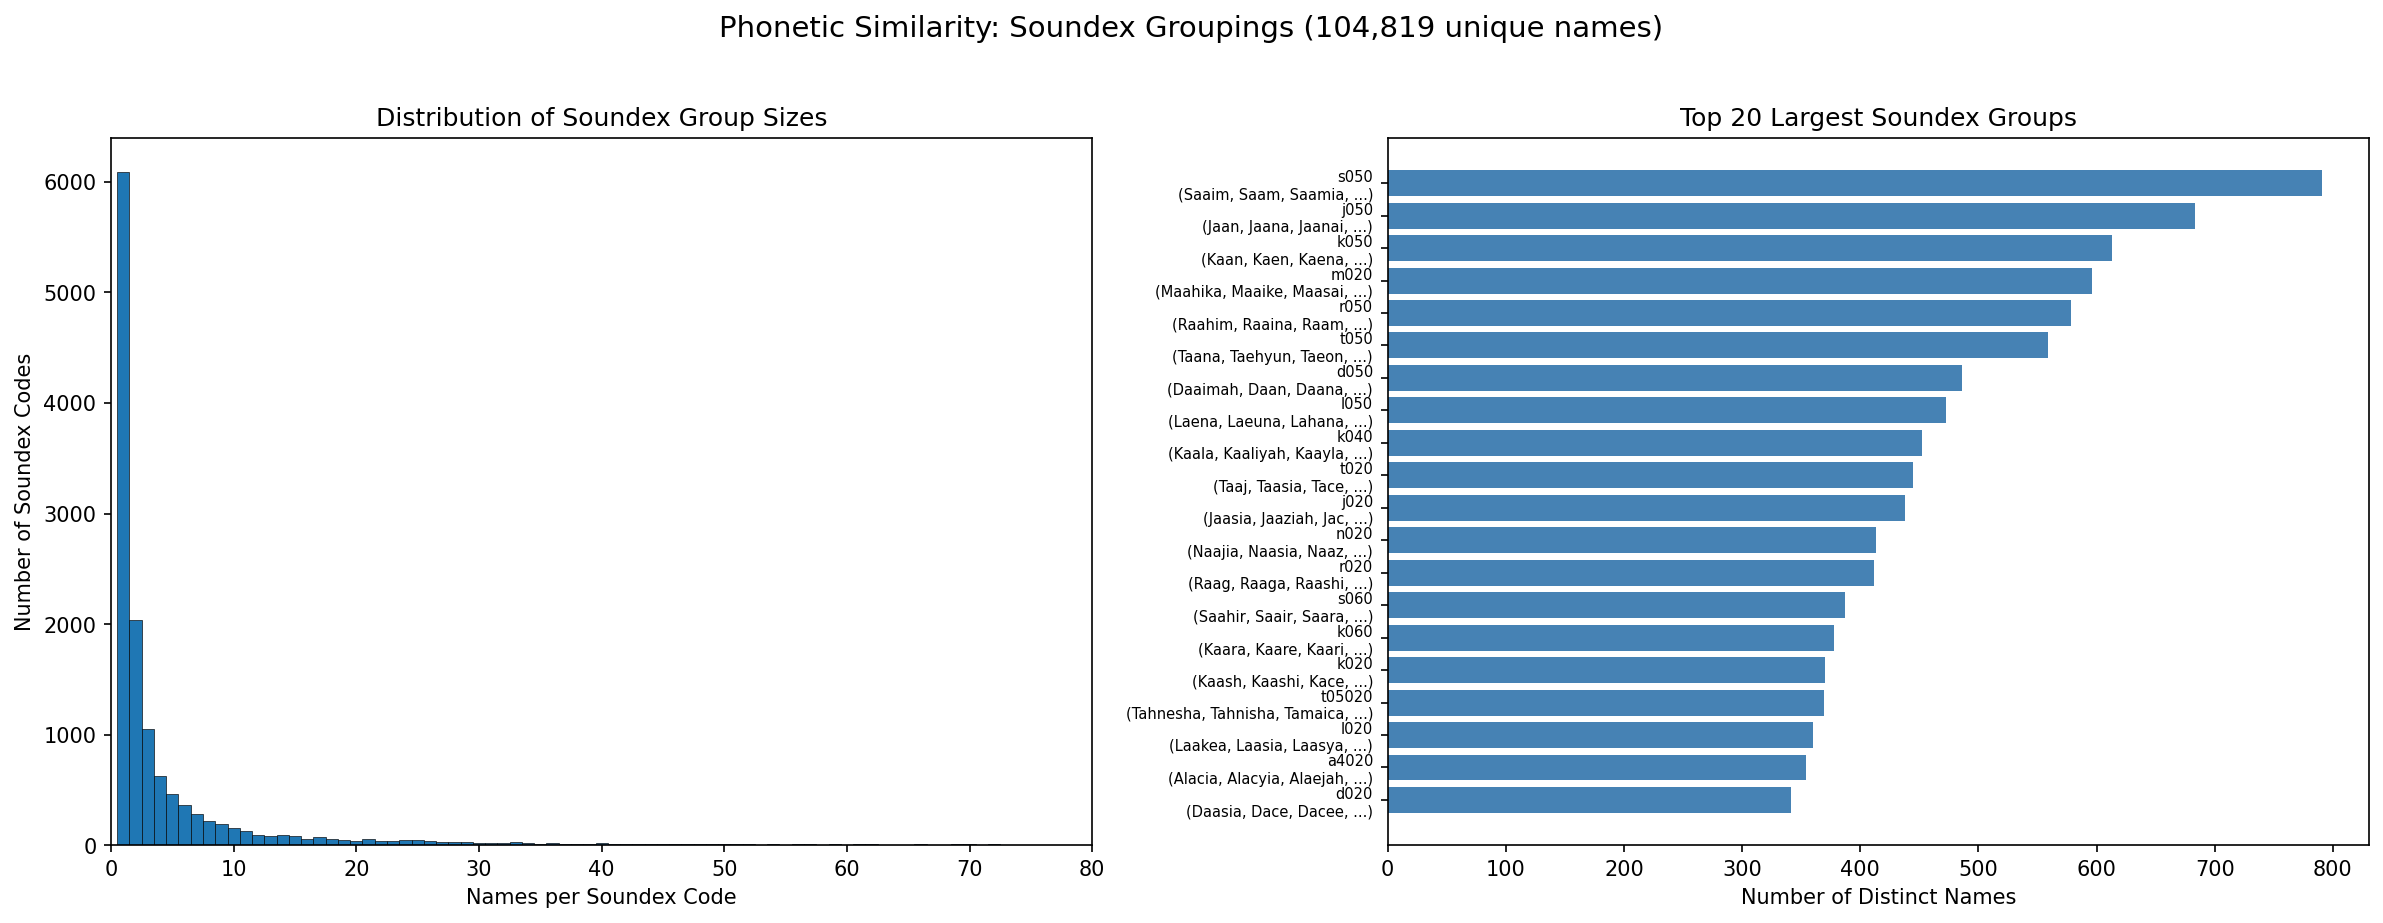
- Heavy right skew: Most Soundex codes map to 1–3 distinct names; a few map to hundreds.
- Top groups share simple phonetic frames: S050, J050, K050, M020 — common consonant-vowel templates.
Phoneme trends
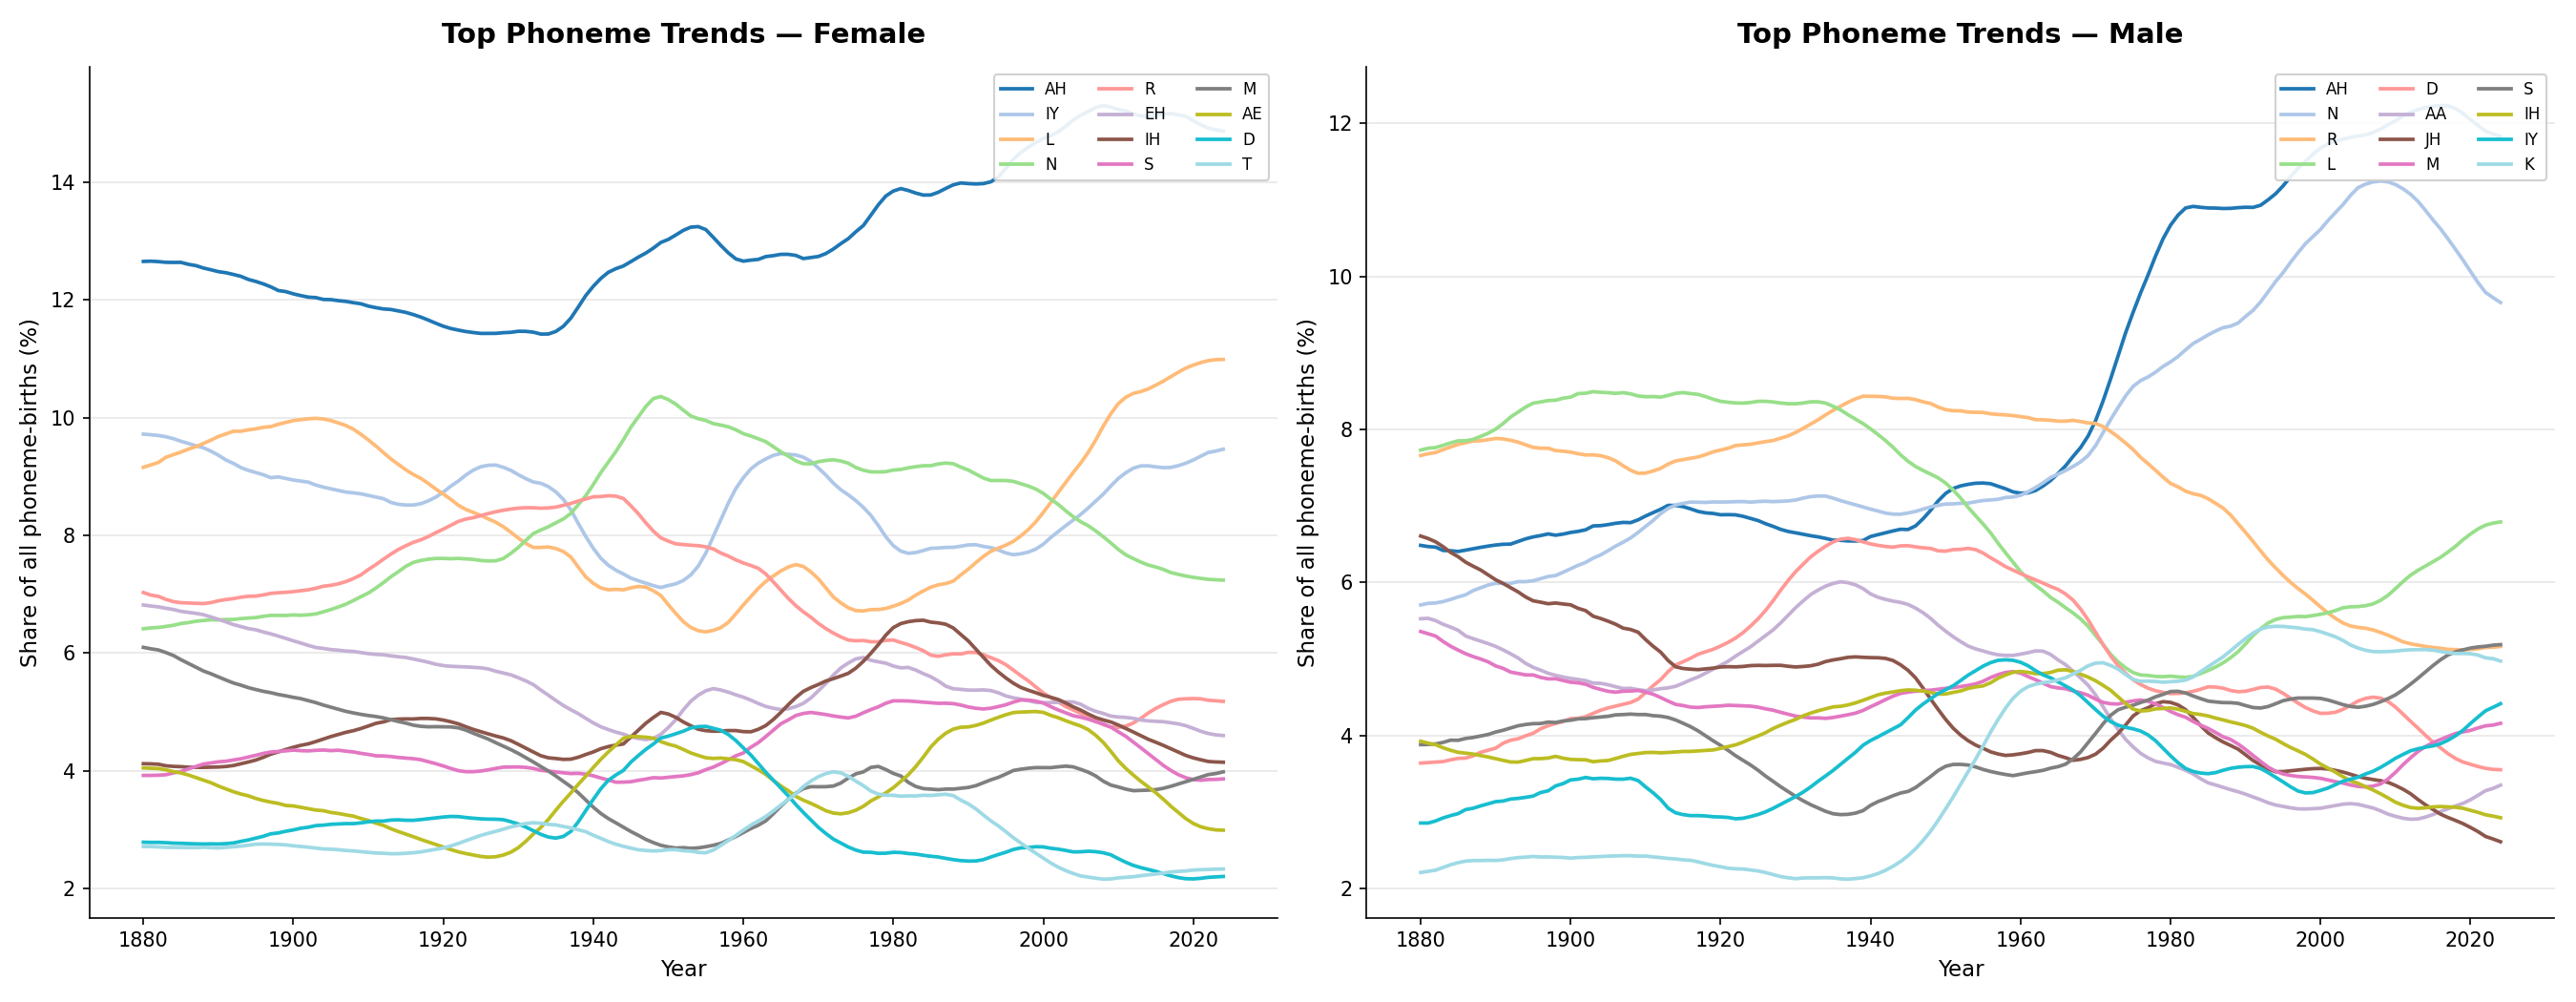
"AH" (schwa) and "N" dominate female names; "R" declined (Mary/Margaret/Barbara fading); "L" rose (Olivia, Emily, Ella). For males, "N" has been rising steadily, tracking Aiden/Jayden/Ethan.
Cultural event fingerprints
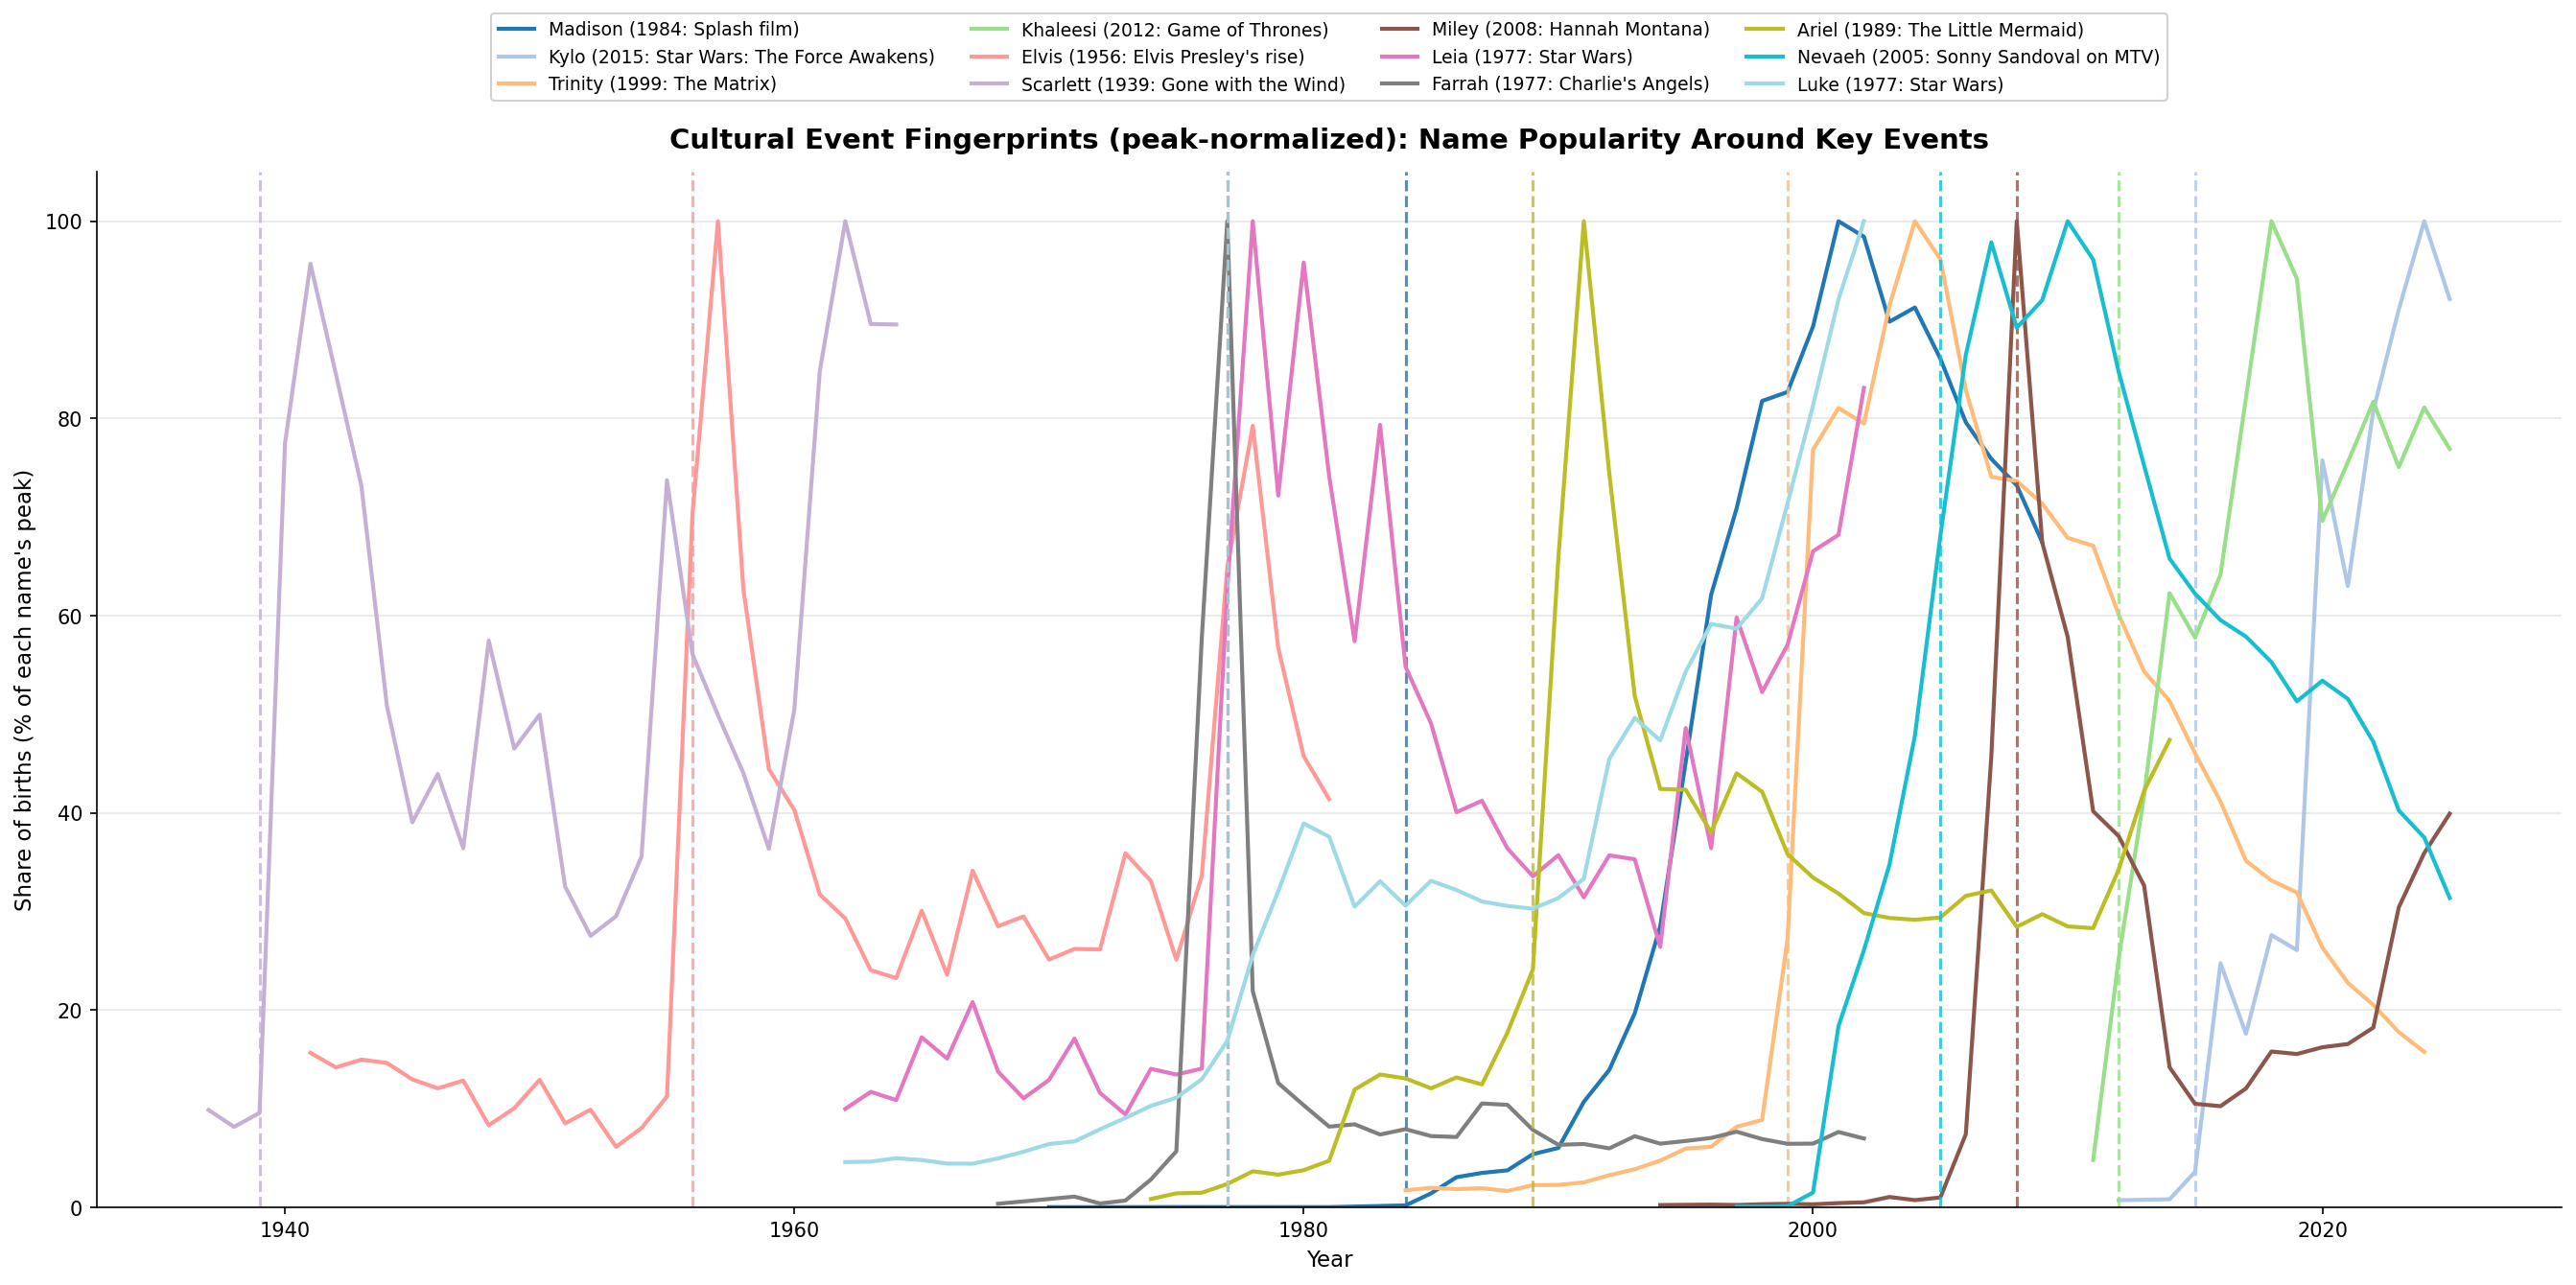
Pop-culture characters with strong, narrow appeal (Kylo after The Force Awakens, Khaleesi after Game of Thrones, Farrah in 1977, Miley in 2009, Elvis in 1956) produce strong adoption followed by quick decay. Names attached to broader cultural moments (Madison after Splash, Luke and Leia after Star Wars, Ariel after The Little Mermaid, Trinity after The Matrix) ramp more slowly, plateau for a decade or more, and decline more gently.
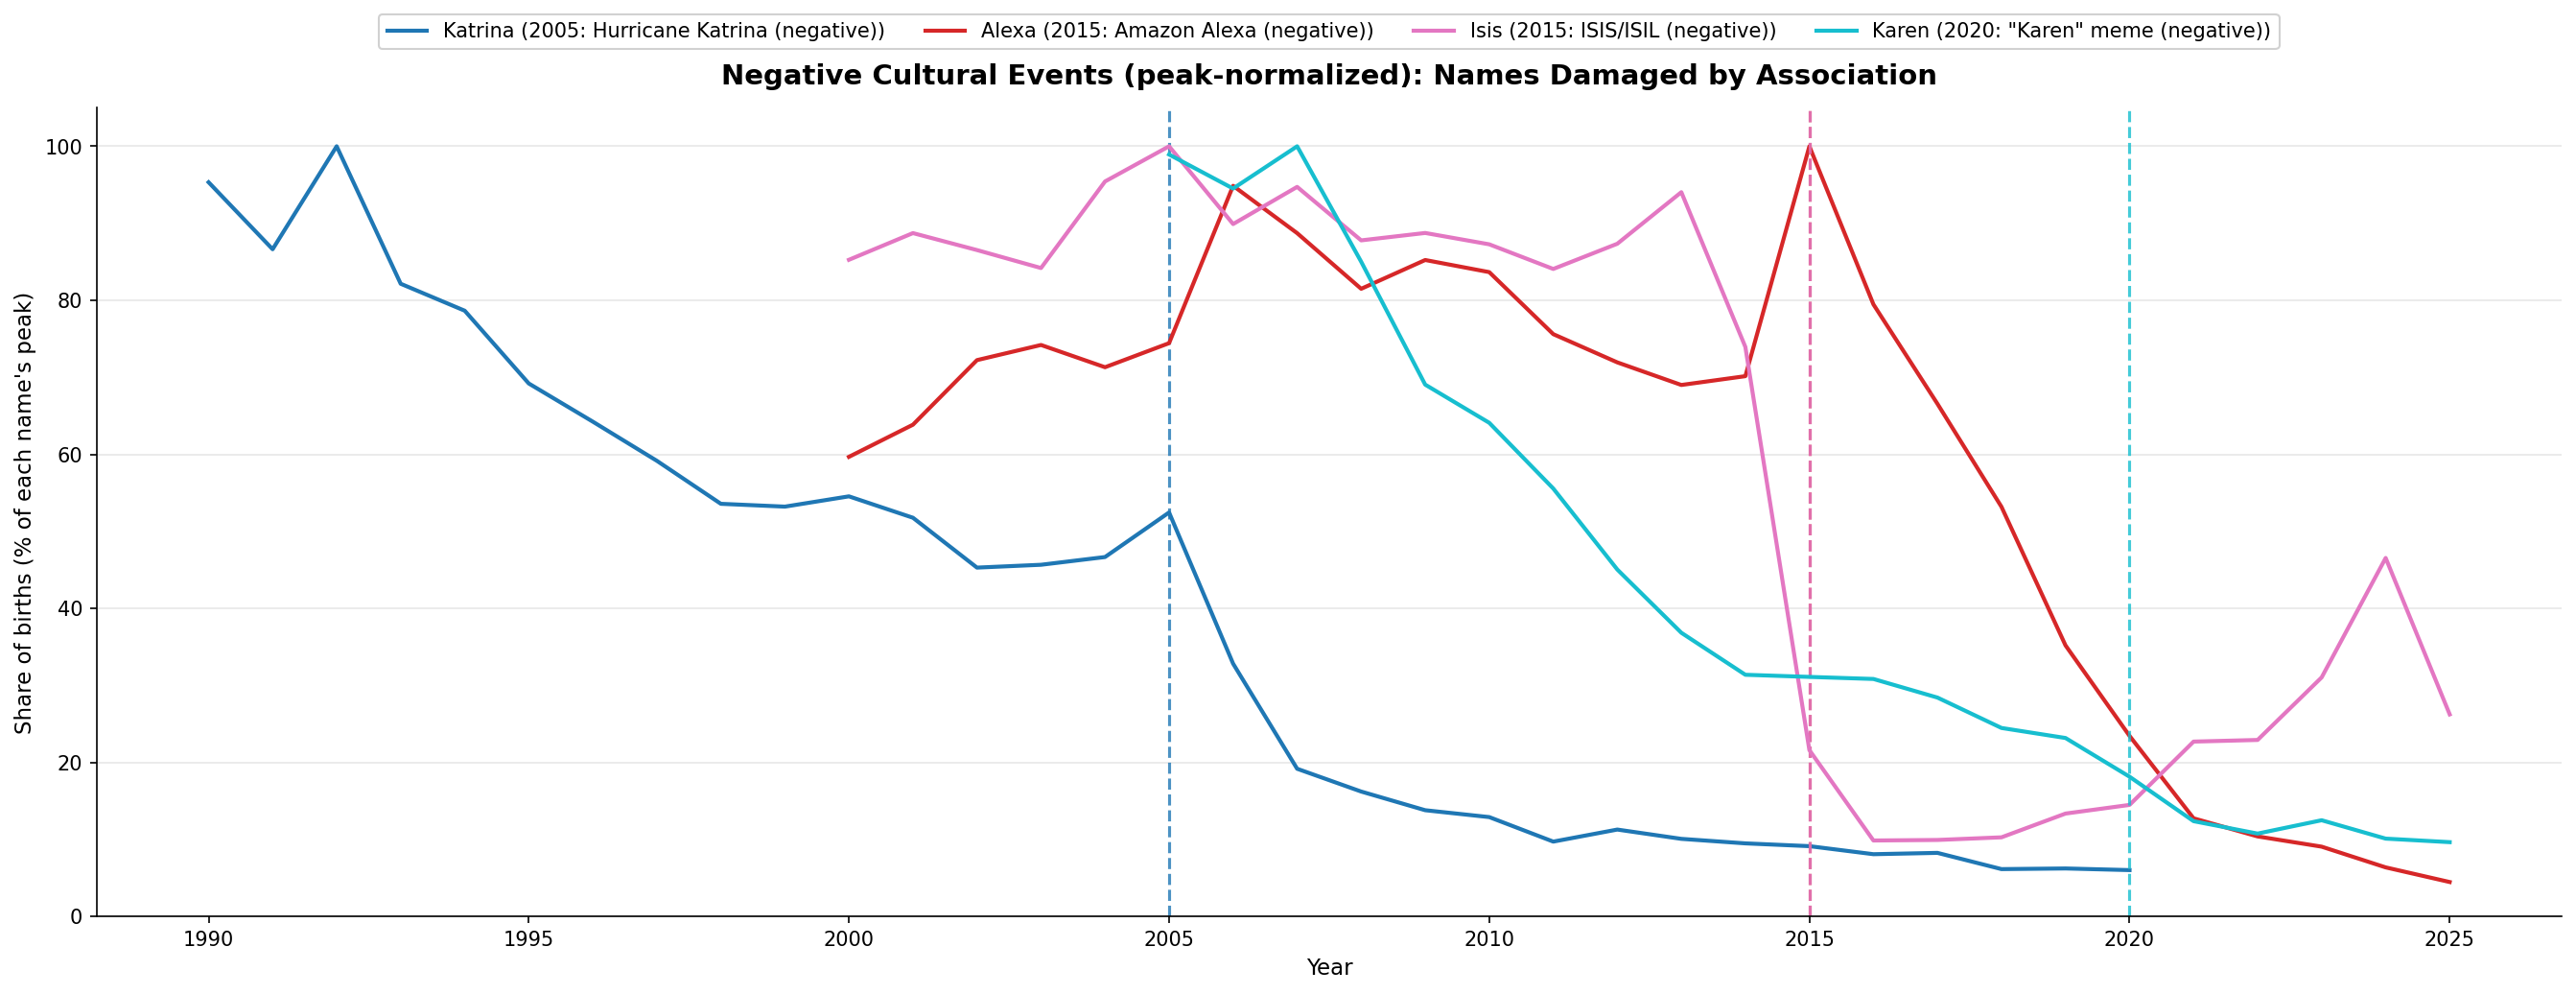
Alexa was healthy and rising right up to 2015, then collapsed when Amazon's voice assistant took the name. Isis sat in the 85–95 band through 2014 before also falling off a cliff. Katrina and Karen were already declining before their events (the hurricane and the meme, respectively), but the events seemed to accelerate the decline.
What's the impact of AI naming?
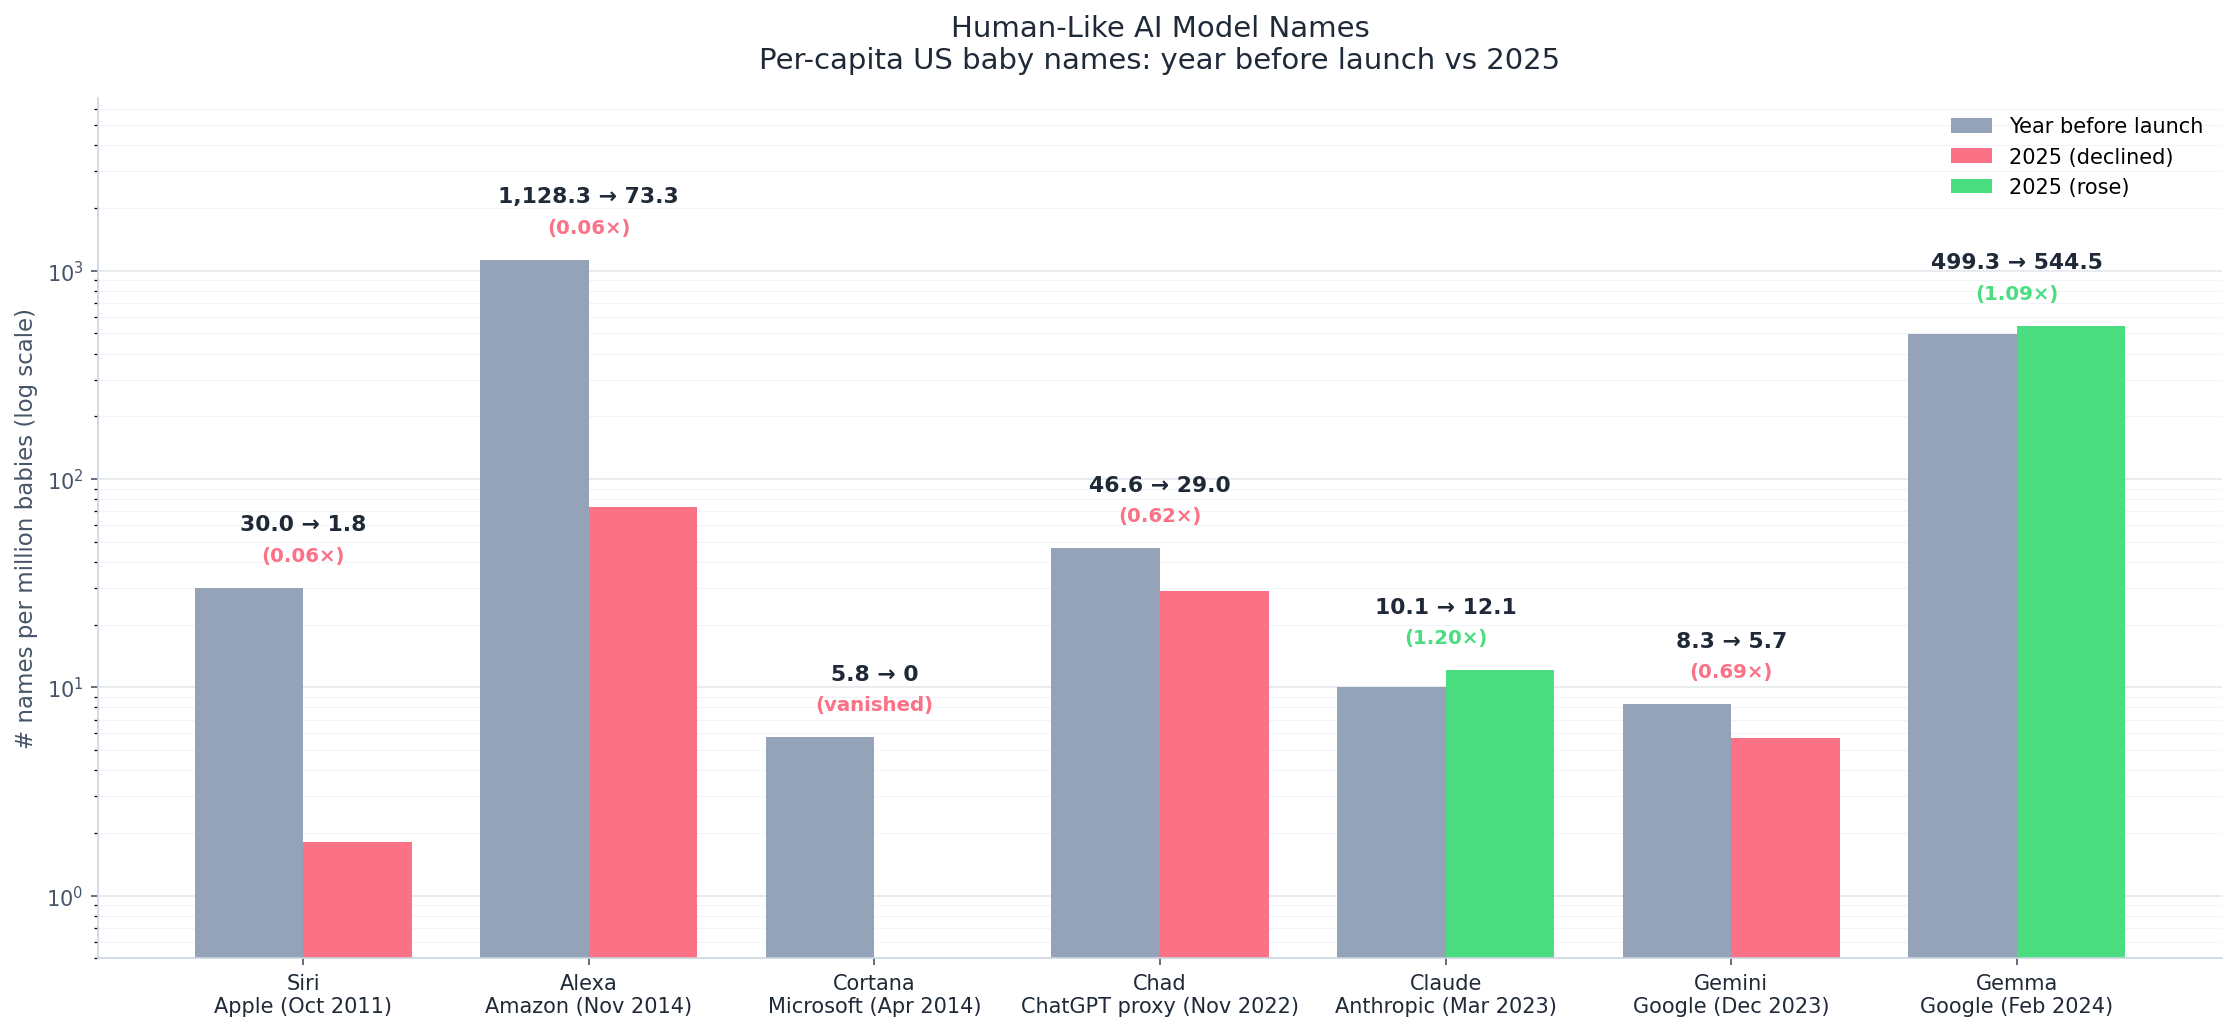
Three prominent voice assistants with human-like names all dropped after their respective launches: Alexa fell from 1,128 to 73 babies per million (a ~15× drop), Siri from 30 to under 2, and Cortana vanished (though it was quite rare to begin with).
The LLM era looks a little different. Gemini slipped modestly (8.3 → 5.7) and "Chad" (a ChatGPT stand-in) slid from 47 to 29, but Claude actually rose (10.1 → 12.1) and Gemma, which was already a popular name well before Google's model, has continued to climb (499 → 545).
Are baby names a reflection of our culture?
The loudest signal across 146 years of data is the collapse of the common name. The top 10 names for both boys and girls now cover under a tenth of all births, down from a quarter to a third a century ago, and the names that do reach the top now fade in half the time they used to. Individuality is rising.
But a deeper look shows that the explosion of new names comes mostly from creative respellings and more even distributions over them, rather than very novel names (like "X Æ A-Xii"). Unique phonemes and unique trigrams stopped growing in the 1930s.
Put together it feels a bit paradoxical: parents are making their baby names more distinctive, but reaching for the same handful of sounds and minor variations to do it.
Gender-neutral names feel like a recent invention, but they really aren't. Names have been drifting across gender lines for over a century (Willie, Marion, Jamie, Jordan). The usage of gender-neutral names is on the rise, but it's a gentle climb. And the names that do qualify as gender-neutral (over a broad set of heuristic definitions) still lean pretty heavily toward one gender. The last two letters of a name predict gender better than almost anything else, and that has barely moved in 146 years. Some gender lines are softening, but overall it appears to be very gradual.
Why I did this
A few friends have asked. The honest answer is that a lot of them are starting to have kids, and naming one is among the first and most permanent decisions a parent makes. If each name serves as a small vote about gender, individuality, sound, identity, is what we choose to name our babies like a slow-motion portrait of a culture?
Final thoughts
Candidly, I wouldn't have gone this deep without AI. The project still took somewhere between 20 and 30 hours in total. The bulk of that time wasn't making plots, but in deciding what questions to ask, and then understanding, checking, and curating the results.
I started the project in February 2026, and at the time the SSA had only published data through 2024. It usually takes the SSA April of the next year to release the prior year's data, but when the new 2025 data dropped I was pleasantly surprised at how easy it was to update and refresh all of the charts and analysis, which would have been much more painful to do pre-AI. Maybe one day, we'll be able to ask AI to update and maintain neverending yearly analysis like this forever.
One thing I came away grateful for is that the SSA publishes this data authoritatively and openly. When I looked around, it seems like no other country publishes data this complete and organized. I'd love to analyze the data for other countries/regions, if that data exists. In the meantime, if you're about to be a parent (in the USA or otherwise), I hope this was interesting, and good luck!